
Learning Non-Linear Relationships in the Cross-Section
Ricardo Pachón (CS) and Valerio Sperandeo (MathWorks), Credit Suisse
Asset managers use factor investing to explain and forecast individual asset returns and to construct portfolios. A factor approach can help to increase diversification, improve returns, and minimize risks. Classic factors include value, size, and momentum, but the list of modern “candidate” factors is exceedingly long.
Credit Suisse’s equity investment strategist Ricardo Pachón Cortes and Valerio Sperandeo of MathWorks® discuss how to effectively apply machine learning techniques to a range of factors available in the HOLT dataset.
In this presentation, they explain:
- How to apply factor-timing techniques as well as machine learning techniques to choose between factor weights
- How to optimize the hyperparameters in the fitting process
- The outputs of the machine learning process
Published: 14 Feb 2022
Good afternoon, everybody to this session on machine learning for factor investing. I hope that you have been having a great day with a wonderful program that we had at the conference.
My name is Ricardo Pachon, and I work in Credit Suisse HOLT. This is a team that, for over three decades, have been developing and maintaining an industry leader corporate valuation framework. Over this period of time, Holt has been growing and curating a high quality database of companies that now has hundreds of corporate characteristics for more than 70,000 companies, 20,000 of which are live at the moment.
I work in the investment strategies team within Holt. And what I do is to help clients to develop systematic strategies for factor investing. And over the last couple of years, I have been in charge of enhancing our offering with machine learning techniques.
Also during this period of time, we have been revamping our technology for all the things that we do. And what we did was to bring to the center of the computational engine that we have a mallet, which is now at the center of the powerhouse of all of our computational engine.
We did that because we found that in MATLAB there were many of the requisites that we needed for our work in terms of scalability, speed, speed of development, and also being able to connect to other satellites software and tools that we use for our work. So we have been doing that for a couple of years.
And early this year, I had a conversation with MathWorks, and we were discussing machine learning. And we have been getting their help for doing some of the work that we have been doing and, in particular, the one that I'm going to be presenting to you today.
In the call is Valerio Sperandeo from MathWorks. And he will say a few words later on in this call. But yeah, MathWorks very kindly invited me to give this talk to share what we have been doing in the space of factor investing.
So I'm going to go now to the slides. And let's start with what factors are. Factors are common characteristics of assets that either explain returns or help our drivers of Alpha. And the common characteristics that I am referring to, which are not only exclusively of the equity space, are things like whether something is cheap or expensive, whether something has a strong market sentiment or not, whether it's something has high quality or not, and so on.
And I think that this view that we have at the moment signals the final point in an evolution of how we are considering investing from an initial view that all equities were providing basically the same type of risk to the current one in which what we see is that there is a way in which the returns can be split into different drivers, which are these factors.
Now any factor can be measured in different ways. Think for example of valuation, which you can be measured with a standard price to book ratio, or PE, or price to free cashflow, or EV/EBITDA. And so on. In HOLT, we have used our methodology to construct various metrics, which then we aggregate for building this course in some of these factors. Say, for example, we have our own version of HOLT quality, momentum, valuation, and so on.
But as soon as you have already a way of scoring stocks, you have mechanisms to study the cross-sectional information that you have of a certain portfolio. And what you can do is, for example, create portfolios of long shorts, where the long leg is composed by companies in the upper quintile of a particular score. And the short leg is in the bottom quintile of that particular score.
What you see in this slide is the performance over 30 years or so of four of these factors done in this way for a global universe for quality, momentum, and valuation, But also, we have the composite overall score, which brings together quality, momentum, and valuation with equal weight.
Now the problem that we are trying to solve today is what's going to happen in the future can we say something about the performance of any of these factors at any given point. And what we would like to have is a mechanism to switch between say, for example, value and momentum, or quality, and so on.
Now the literature about this topic is quite extensive. And I'm just going to point out to three papers that I think encapsulates a bit of the ideas that have been going around this. The first one is Campbell and Shiller of 1998, in which they made the observation that valuations of aggregates of our universe of companies are predictors of the returns of those aggregates.
And I want to illustrate that with the plots that you see on the right of this slide, where each of those circles corresponds to information of an aggregate of companies in the US at a monthly basis for over almost 40 years. So each of those circles corresponds to monthly information.
The x-axis corresponds to an average valuation. And in this case, I'm using the whole economic PE, which is an equivalent to the classical PE ratio. But you can do this with any other valuation metric. And on the y-axis, you have the aggregate, the average return of that such portfolio over a specific window of time in 3 months, one year, three years and five years.
The conclusion of Campbell and Shiller was that as you're increasing the time window, then you're going to see a better fit with R squares going from 4% to almost 60%. So the conclusion there, which was also developed by Shiller and Fama and French and the likes, was that the equity risk premium varies across time and across assets.
Just that word of caution here, these conclusions and the results that you see here are actually using overlapping time windows for constructing the returns. And this is an important thing, because actually this increases that fit that we are seeing. And if you do the exercise by actually not using overlapping windows of return, the conclusion is slightly different.
So the reason why I wanted to show you this is to, basically, make two points. First there is some phenomena when you're aggregating the information, cross-sectional information, of a certain group of companies. But also that even if you're working on a very simple linear model as the one that you see here, where we are just doing a list of squares fit, you need to take into account problems like overfitting, and embargoes, and things like that. Otherwise, you might get a distorted image. this is something that, of course, is going to prevail when we're doing machine learning.
The other paper is Goyal and Walsh from 2008. Basically, the observation from them was that the historical average is actually a better predictor than the regressions with any other variables that are quite popular there. And the last paper that I want to cite is the one that we use for a lot of the work that we are doing by Gu, Kelly and Xiu which was published in February of this year.
And what they are doing is to model the conditional expectation on a k-period forward excess return for a particular stock as a certain function, perhaps nonlinear, that is mapping a vector with P predictors into the expected excess return. So what we have here is just one function that is not parameterized by either the specific stock or a specific point in time that you can use to do predictions of the excess returns on a particular time window for all companies for all periods of times.
In this paper, Gu and his coauthors use 94 stock level characteristics plus 8 macroeconomic variables. And then they merged them to construct their covariates. And just here is the point where I'm going to say something about machine learning the shape of F is going to be derived or is going to be inferred by using machine learning models. And it's using these machine learning models is that we are going to accommodate the data in such a way that it allows us to explore not only the functional form and also the interdependence of the different variables.
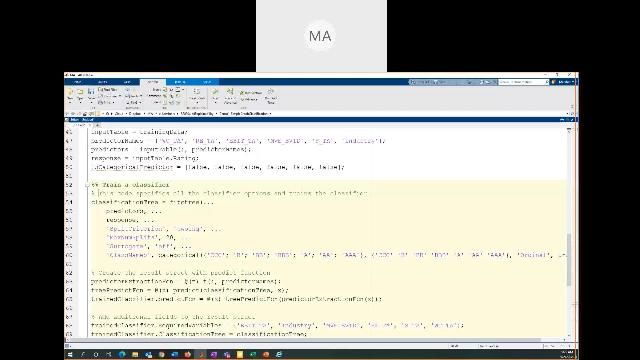
Two methods that we use for this are based on decision trees and based on neural networks. So we tested things like random forest, and boosted trees, and things like that, which in essence from a functional point of view, what they're doing is to approximate or to construct functions that are piecewise constant.
And neural networks on the other side, they are linear combinations of compositions of activation functions with finite functionals. I think that the important thing about saying about neural networks, at least if we are thinking about this function after we are trying to infer, is that there are universal approximation theorems that tell you that for a particular set of functions neural networks even in shallow neural networks as the ones that we use, feedforward neural networks, they are enough to approximate any function in that space. The implicit assumption, of course, in doing this whole exercise is that actually that function F that is not only my returns is actually of this form.
I just want to show you how machine learning differs from the standard econometric form of for modeling financial data. Here on the left, you see a standard model for modeling dividend growth, which is a twin problem for the point that we are tackling of return prediction. And you see here, the model by Møller and Sander, which uses dividend yield and earnings yield to do the prediction.
On the right, you see a slide of obtained from using machine learning, which we use many predictors. But here in particular, we are zooming in to what is the machine thinking about these two variables, earnings yield, dividend yield. And notice how the similarities are at least in terms of the overall form. However, the machine learning methodology allows you to accommodate data in a better way, in such a way that actually you are seeing these valleys, and you're seeing these flat regions that are giving you a much more granular information of how it looks like.
Now, a few words about the data that we are using. We are using HOLT data as our predictors together with a lack of market signals as a form of a macroeconomic indicator. 18 of those 25 variables are HOLT variables. And the target that we are going to that, we are going to set up for this supervised learning exercise is the monthly return in excess of the risk free rate. And what we do is to construct these observations if we have predictors together with the target of one month forward. We have around three million observations in US, Europe, and Japan.
And just to say something about the specific whole variables that we use, we can have a very long conversation about the specific variables. But I think that what I wanted to say is that what we do is to create variables that are better for comparing firms across time, and across regions, and across sectors. And the way that we do that is by carefully removing distortions, for example, due to accounting.
In the graph that you see there we are comparing the classical ROE, which is a measure of quality versus our CFROI metric, cashflow return on investment. And we are seeing this example for Boeing. You can see how ROE is going up and down just for changing they're for the accounting rules, or because of some actuarial gains that do not reflect really something deep on the business. CFROI is actually a much more stable metric that is encapsulating this quality element.
Now the last thing is about, in terms of the setup, we did at cross validation analysis and for that you need to be very careful about how you're splitting your training validation testing sets. Just to highlight something that you need to be very careful is that it's not only important to just make sure that your samples, that your observations, for these three types of data are in disjoint sets. But they should not be overlap at the same time period.
Another thing that we did for analysis was to run several times or fit many, many models with the same parameters. Just to have an idea of how much volatility we were having due to the stochastic components that you have whenever you are filling the models with machine learning.
But for that we had to do a very, very thorough exercise in the optimization of the hyperparameters. And this is something that MATLAB and MathWorks was very important for work on this. So for this actually I would like to hand it over to Valerio to say something about the hyperparameter optimization.
Thank you Ricardo. And hello, everyone, also from my side. My name is Valerio Sperandeo. I'm application engineer at my MathWorks mainly focusing on financial application developing and supporting our users in financial applications.
So one of the most important tasks when it comes to machine learning in a typical machine learning workflow is the optimization of the hyperparameters. This task is particularly aiming at improving the accuracy of the machine learning model, and on the other hand, in minimizing the prediction error of the machine learning model itself.
And the way that it's being done is by adjusting its hyperparameters. There are typical common approaches that are being used. I have listed some of them here in the slide. One is grid search. Another one random search in Bayesian optimization.
I will speak mostly about Bayesian optimization since it's typically resulting in better performance over the two others. Just a few words around grid search, grid search is a technique that can be used in evaluating an evenly spaced set of hyperparameters. This comes with the downside that you can be evaluating for a lot of iterations, many non-important hyperparameters.
In order to avoid such a problem, you can maybe try to explore random search. In this approach you are looking at sampling more hyperparameter values for hyperparameters that are more relevant for your problem and for your objective function,
And ultimately, Bayesian optimization, in this approach you are creating a surrogate model, which is a mapping between the error function, which is the objective of your problem, optimization problem, and the hyperparameters themselves. It uses a Gaussian Process model. And this is particularly useful, because it's keeping the past evaluations into account.
And why is that so relevant? Mainly because using past information, past evaluations, within the optimization problem, you are able to keep track of that information, and therefore looking at regions of the hyperparameter space that might be more relevant. And when I mean relevant I mean might be more important in terms of minimization of your error measure that you are taking into account.
So Bayesian optimization is also important in terms of computational speed. Typically, hyperparameter optimization is a very time consuming task. Using Bayesian optimization and the fact that you are keeping the past evaluations into account will help you also in terms of speed. You are not going to evaluate the objective function in correspondence of hyperparameters values that are not important to you or are not bringing any additional benefit.
If we move to the next slide, we will see how we have been using Bayesian optimization along with MATLAB parallel computing tools in order to reduce the computational time of this task of the optimization of the parameters. And MATLAB also offers a very straightforward way of running such a polarization.
And we see that in this example in this slide, where we are calling the function Fit R in sample. We are simply training a regression n sample. We are, among the options of this function, we are selecting the hyperparameters that we want to optimize. And ultimately, you see that in the red box, we are also defining additional option for running in parallel the evaluations of this type of optimization. And you will see that this was particularly beneficial to us.
Another thing that we have been using and another benefit that has brought us parallel computing is offloading the calculations from MATLAB to our cluster. So we have actually, as I said, run the multiple evaluations of our Bayesian optimization problem on a parallel pool. So on a pool of parallel processes, MATLAB processes.
But, m m, have also moved the calculation from our MATLAB desktop to the cluster itself. So in that way we were still able to continue working with MATLAB. The calculations were being performed on a cluster. And in the meantime, we could have tested other models, run other analytics, and so on.
And again, this is pretty straightforward. The batch function you simply specify the model that you want to move to the cluster. You also specify the size of the parallel pool that you want to use for running such an optimization. And once that is finished, you can, of course, also-- there are tools to monitor the status of the optimization. Once the optimization is done, is finished, you can simply call the function fetch outputs. And that in our case has retrieved the forecast provided by that machine learning model.
In the last slide, I'm going to show you how actually on a practical case, what kind of benefit the realization has brought us. I have compared the optimization while the training and the hyperparameter optimization of bagged and sample model with Bayesian optimization on a single year of historical data.
Obviously, in a backtesting framework, you are testing your model over multiple years. Now this example is referring only to the training and optimization on a single year. If you were to run it over the entire backtest, you would have to train and optimize or at least following our framework. We would have trained and optimized at every single year.
So running the optimization serially has taken us over 6,000 seconds, almost two hours. You can then multiply it by the numbers of years or of optimizations that you want to run. By scaling the calculations with parallel computing already with 10 parallel processes and what we call workers has reduced the computational time down to 77 seconds.
We have also tried with 50 workers, which has brought the time down to 13 seconds. But yeah, if we then look at the parallelization efficiency how efficient the parallelization has been performed over the different parallel pools, we see that the slope of that line that you see in the plot is higher already when you're scaling up to 10 parallel processes.
You're still going to gain a benefit with 50 processes. But the biggest benefit is being brought by 10 processes. And with that I hand back to Ricardo. Thank you.
Thank you very much Valerio. So now let's jump to the results then of these massive computational exercise. And here in the table you see the average R squared for basically the single stock predictions of all the companies in that first column. And there are a few points that I want to mention. There are the OLS on the first row corresponds to a linear as far as a model with quality evaluation and momentum.
And you can see there how it compares to the machine learning alternatives that we have been exploring with, for example, random or decision trees, and samples, or bag decision trees. I think that one of the things that we see here connecting to what Valerio was mentioning was that Bayesian optimization seems to be giving you a better accuracy in terms of this out of sample R squared compared to a grid search.
The other conclusion here is that those two columns to the right shows the out of sample R squared and the average and the standard deviation of all these fit models. You see that the R squared of the smaller companies tends to be higher than for the big companies. Big and small are defined as the 500 largest companies or the smallest companies. And this exercise is for the US. And this goes in line with some observations in the literature that says that points that anomalies tend to be more seen that they are more visible in the smaller side of the spectrum.
And finally, the other observation about this single stock performance results is that just by increasing the complexity or the nonlinearity of your model that doesn't mean that you're going to have a better accuracy. And you can see how when you have in that model ten which has three layers, the results are actually quite worse, quite bad, that they're even worse than a simple OLS method.
At the end, we are going to be using an ensemble of the OLS, boosting sample of trees, and a neural network. And that is a model that we are going to be using for a while.
Now at one point before just starting to wrap things up is about interpretability of models. And one of the things that you hear a lot is the machine learning models are basically black boxes. This is not correct. There are many techniques out there that allows you to see, for example, how a specific variable behaves globally.
And this is, for example, the case of partial dependency plots in which what you are doing is to use your machine learning model just as a deterministic box, where you can basically vary one particular factor and see how much it would have changed the results. In a sense you're creating artificial data and just seeing how the model behaves on that.
And using this you can actually see four different variables, how it looks, and what is the impact of, for example, a discount rate as a whole variable for a company specific discount rate, how it changes or how the returns can be increasing as you are increasing the discount rate. Or dividend yield, for example, how, as you increase dividend yield, the returns are going to be higher. So I think that this connects very well the intuition that we have around many of these metrics that we have with the performance of stocks.
Now the last point is about how we bring all this together. We have made single stock predictions. What happens if we do aggregations of that? Well, what we do is just a pretty simple exercise of creating the long short portfolios that I was talking at the beginning.
And here you see in this table how the R squares, the other sample, R squares go up whenever you are doing this aggregate exercise. We are moving from our source of less than 1% to something around more than 2%, 3%, even 12% for some of these factors of quality, valuation, momentum, or that aggregate overall score.
Having that, what we constructed was a way of, actually, switching between different factors. And the way that we did that was to basically do the predictions of every single month for these four factors and try to see whether they would predict at the correct order of all of these factors. So in essence, what we're doing is a multi classification problem, from which you can extract that confusion matrix that you see to the right.
And the conclusion here is that by constructing this classification model from this bottom up approach, it is doing a very good job at detecting that the top two factors at every month from the bottom two factors. It is not doing such a great job when it is comparing the first and the second, first versus second, or third versus fourth. But that is just an element about this. And I think that this is already what we see there that we have a true rate of around 30% for classifying categories 1, 2, or ranking 1, 2 or 4.
Now the last slide that I'm going to show you is how to put all this into practice. And we explored a couple of strategies around this. One was a winner takes all of which we are taking 100% allocation to the factor with the largest average predicted return.
But as you see there in the top panel, although we were not doing such a great job doing spawning the first top factor, it is still giving us a good return more or less comparable to the overall score. And I think that the feature that we are seeing is that it smooths the return very much reducing the volatility from 10% to almost 7%.
The other strategy that we explored was a 50-50 allocation between the two factors, which actually increased the risk return to almost 1.2%, increasing not only the return but also keeping the volatility down.
Featured Product
MATLAB
Up Next:

Related Videos:


Web サイトの選択
Web サイトを選択すると、翻訳されたコンテンツにアクセスし、地域のイベントやサービスを確認できます。現在の位置情報に基づき、次のサイトの選択を推奨します: United States
また、以下のリストから Web サイトを選択することもできます。
南北アメリカ
- América Latina (Español)
- Canada (English)
- United States (English)
ヨーロッパ
- Belgium (English)
- Denmark (English)
- Deutschland (Deutsch)
- España (Español)
- Finland (English)
- France (Français)
- Ireland (English)
- Italia (Italiano)
- Luxembourg (English)
- Netherlands (English)
- Norway (English)
- Österreich (Deutsch)
- Portugal (English)
- Sweden (English)
- Switzerland
- United Kingdom (English)