epipolarLine
ステレオ イメージのエピポーラ線を計算
説明
例
この例では、基礎行列を計算する方法を示します。最小二乗中央値法を使用して、インライアを検出します。
matched_points1 と matched_points2 は、推定的にマッチされた点です。
load stereoPointPairs
[fLMedS,inliers] = estimateFundamentalMatrix(matchedPoints1,...
    matchedPoints2,'NumTrials',4000);
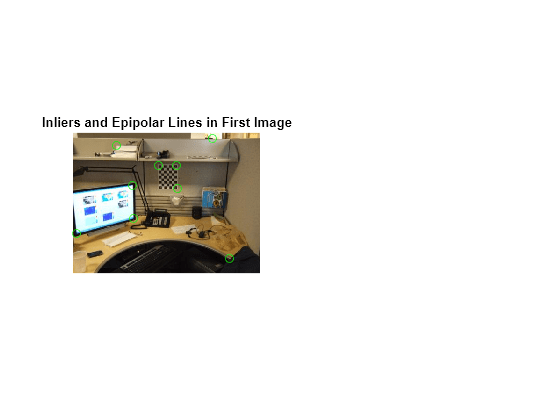
1 番目のイメージのインライアを表示します。
I1 = imread('viprectification_deskLeft.png');
figure;
subplot(121);
imshow(I1);
title('Inliers and Epipolar Lines in First Image'); hold on;
plot(matchedPoints1(inliers,1),matchedPoints1(inliers,2),'go')
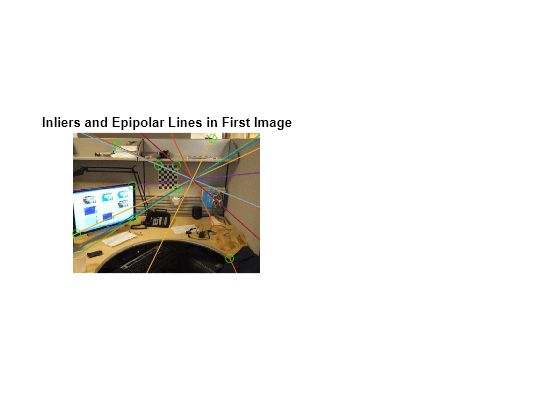
1 番目のイメージのエピポーラ線を計算します。
epiLines = epipolarLine(fLMedS',matchedPoints2(inliers,:));
ラインとイメージ境界の交点を計算します。
points = lineToBorderPoints(epiLines,size(I1));
1 番目のイメージのエピポーラ線を表示します。
line(points(:,[1,3])',points(:,[2,4])');
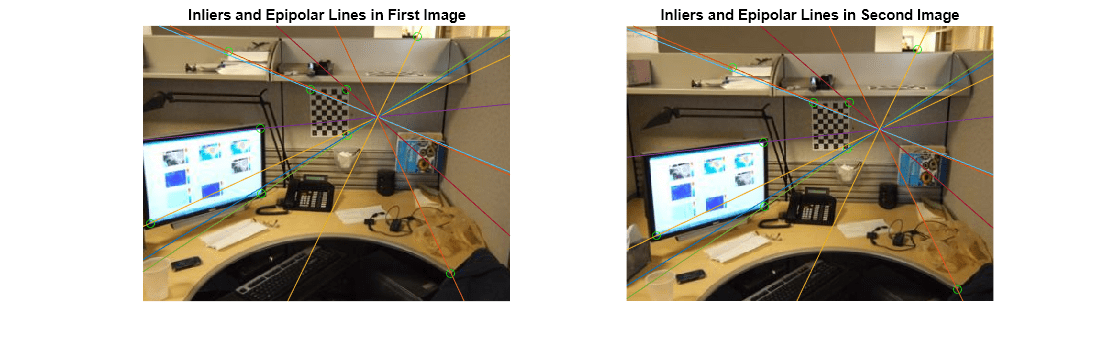
2 番目のイメージのインライアを表示します。
I2 = imread('viprectification_deskRight.png');
subplot(122);
imshow(I2);
title('Inliers and Epipolar Lines in Second Image'); hold on;
plot(matchedPoints2(inliers,1),matchedPoints2(inliers,2),'go')
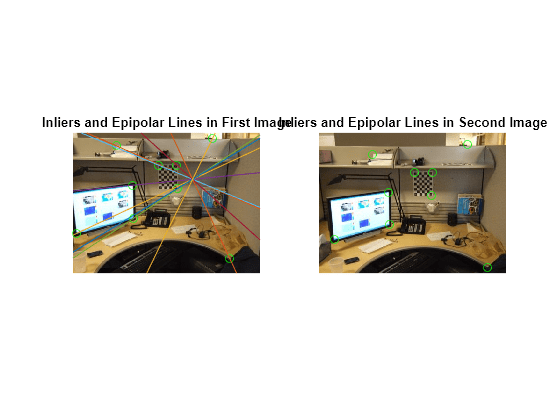
2 番目のイメージのエピポーラ線を計算して表示します。
epiLines = epipolarLine(fLMedS,matchedPoints1(inliers,:));
points = lineToBorderPoints(epiLines,size(I2));
line(points(:,[1,3])',points(:,[2,4])');
truesize;