Analyze UAV Flight Log Data Using Flight Log Analyzer App
R2026bThis example shows how to use the Flight Log Analyzer app to import flight log data, visualize sensor signals, export data for further analysis, and configure custom signal mappings.
The Flight Log Analyzer app analyzes log files generated by simulated or real flights.
Use log analysis to find the root cause of a crash or monitor vehicle health during a flight. For example, determine:
How well the controllers track their references
Whether there is any strong vibration
If the vehicle experiences power failures
Open Flight Log Analyzer App
To open the app, in the Apps tab, under Robotics and Autonomous Systems, click Flight Log Analyzer.
Alternatively, call the flightLogAnalyzer function from the MATLAB® command prompt.
Import ULOG File
Load a ULOG file using the ulogreader function.
ulg = ulogreader("flight.ulg")ulg =
ulogreader with properties:
FileName: "flight.ulg"
StartTime: 00:00:00.176000
EndTime: 00:02:15.224000
AvailableTopics: [51×5 table]
DropoutIntervals: [0×2 duration]
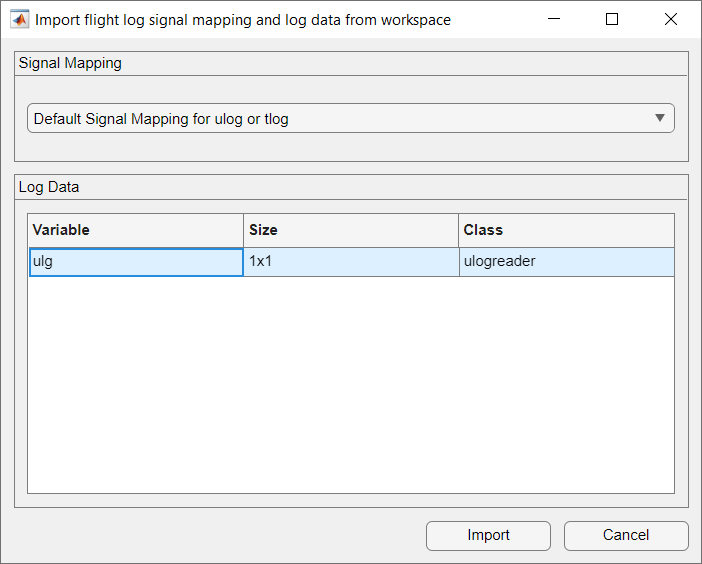
On the Flight Log Analyzer app toolstrip, select Import > From Workspace. In the dialog box, in the Log Data section, select the ulogreader object ulg. Click Import.
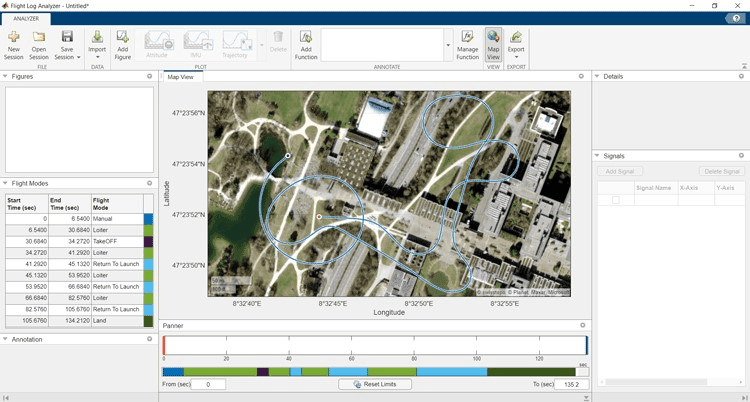
By default, the app displays a satellite map with logged GPS data. The Flight Modes pane shows a table of flight modes with their start and end times.
Create Figures and Plots
UAVs use sensors such as gyroscopes, accelerometers, magnetometers, and barometers to determine the vehicle state — position, velocity, altitude, speed, and rates of rotation. The Flight Log Analyzer app lets you plot these signals to assess vehicle behavior.
Add Predefined Plot
In the Plot section of the app toolstrip, click Add Figure to add an empty figure to the plotting pane.
In the plot gallery, click IMU to add plots to the figure for the gyroscope, Gyro, and accelerometer, Accelerometer.
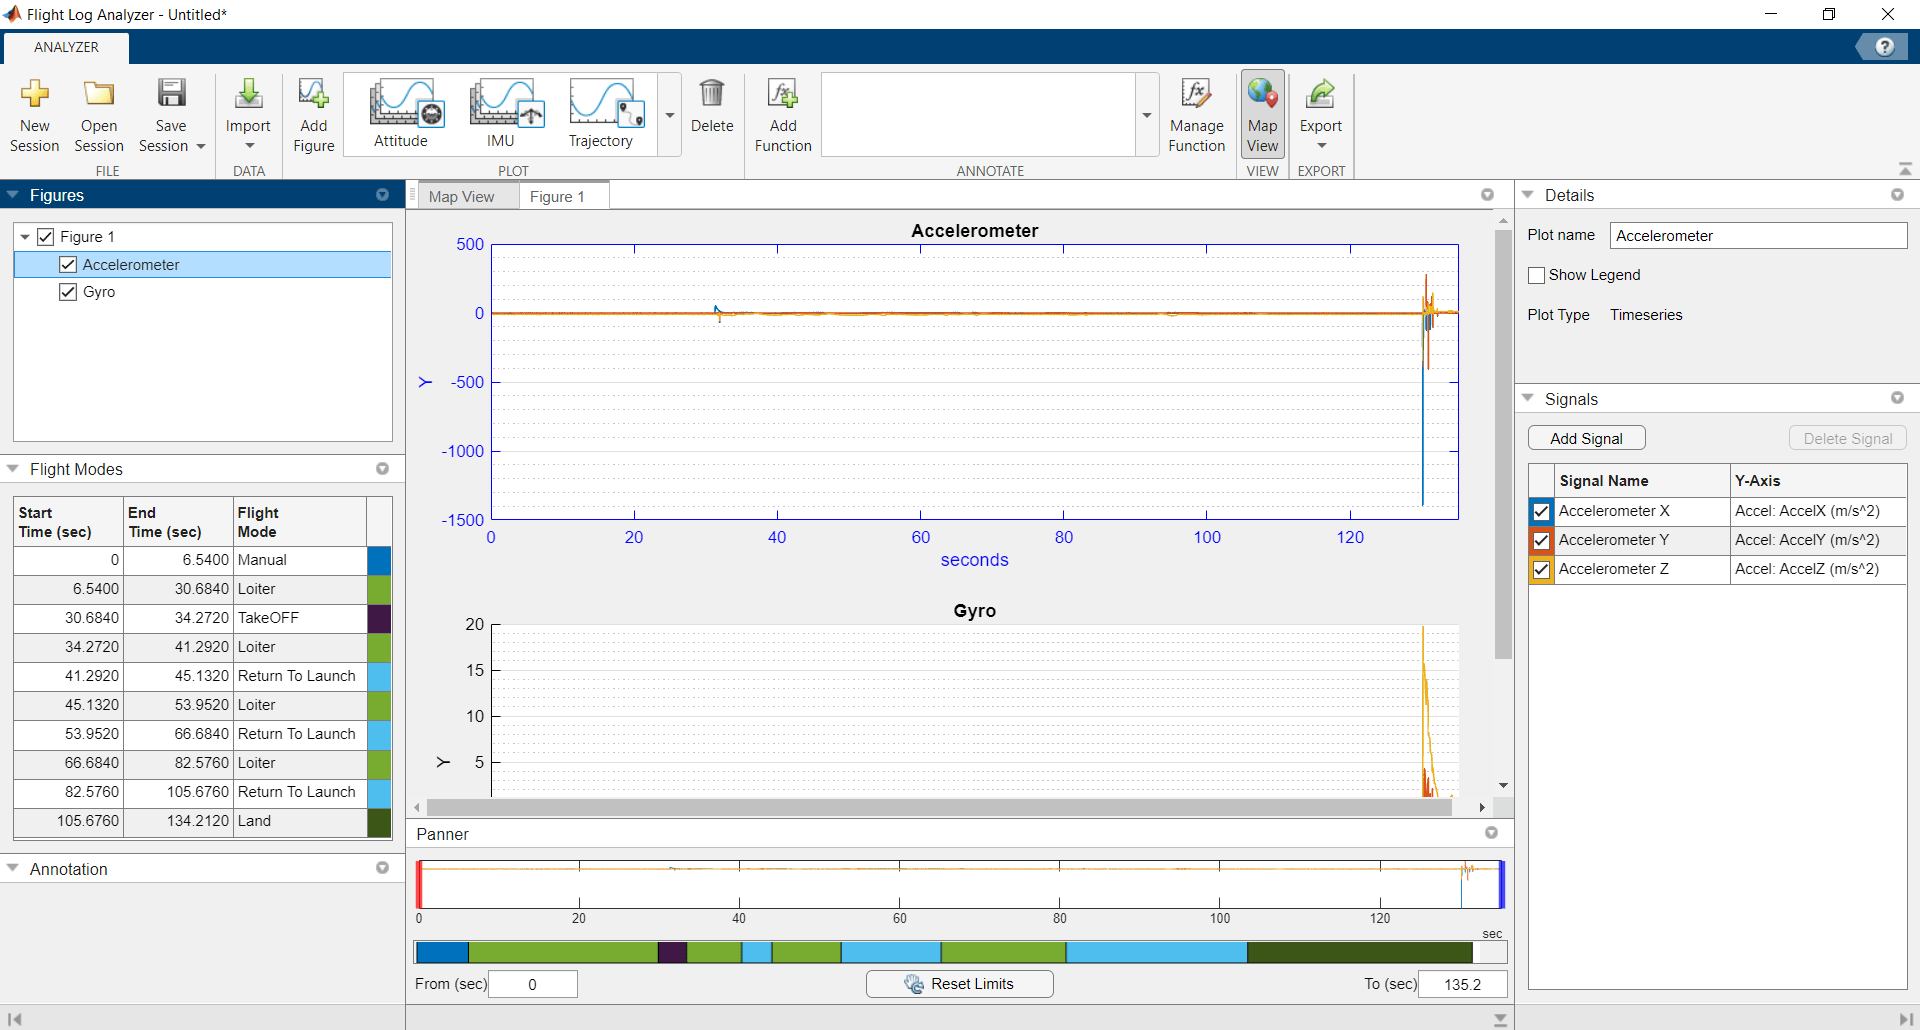
The plot gallery provides additional predefined plots for other sensor data.
Change Plot Focus Using Panner
In the Flight Modes pane, find the first instance of the Loiter flight mode and note its Start Time and End Time values.
In the Panner pane, drag the red handle to the Start Time and the blue handle to the End Time of the flight mode.
Alternatively, type the Start Time and End Time values in the From (sec) and To (sec) boxes beneath the strip plot. Click the Acceleration plot to focus on it.
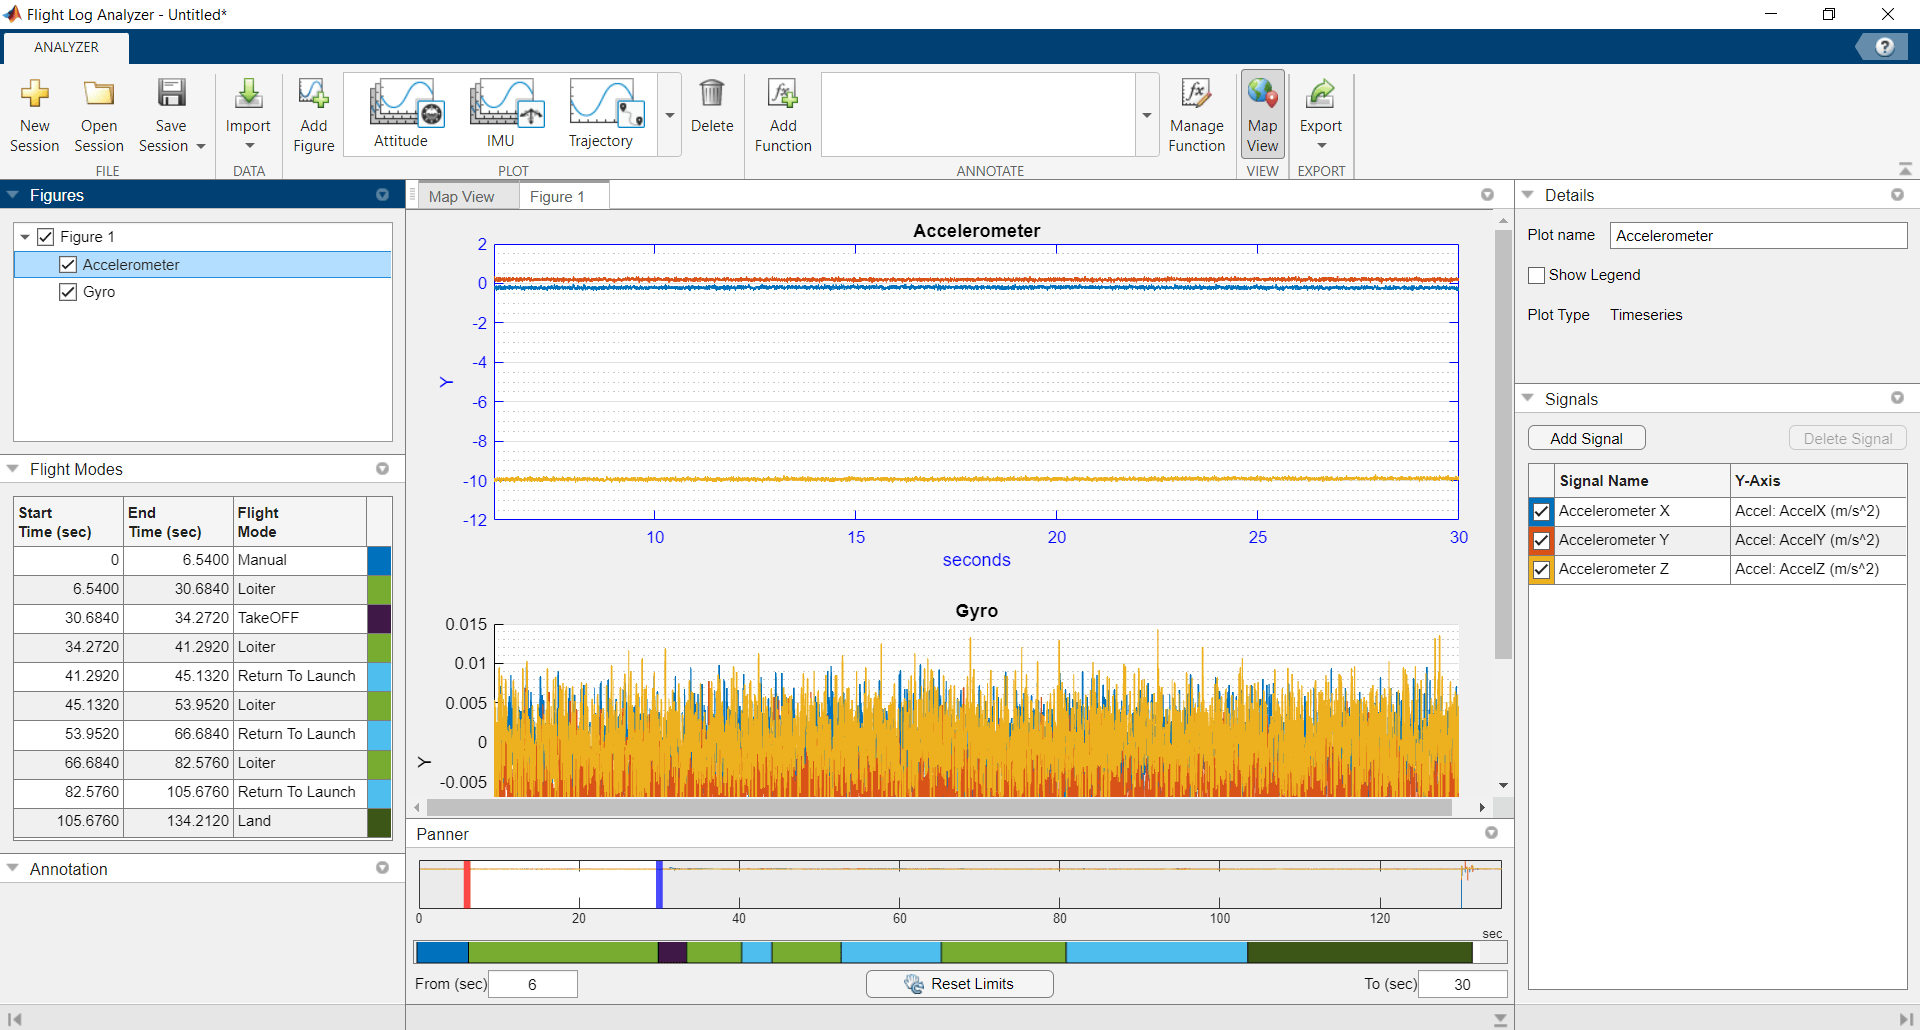
When UAV vibration is in a good range, z-axis acceleration remains below x-axis and y-axis acceleration. In this flight segment, the acceleration data confirms good vibration levels. Use the Panner to focus on the other three Loiter flight modes and observe the acceleration.
Add Custom Plot
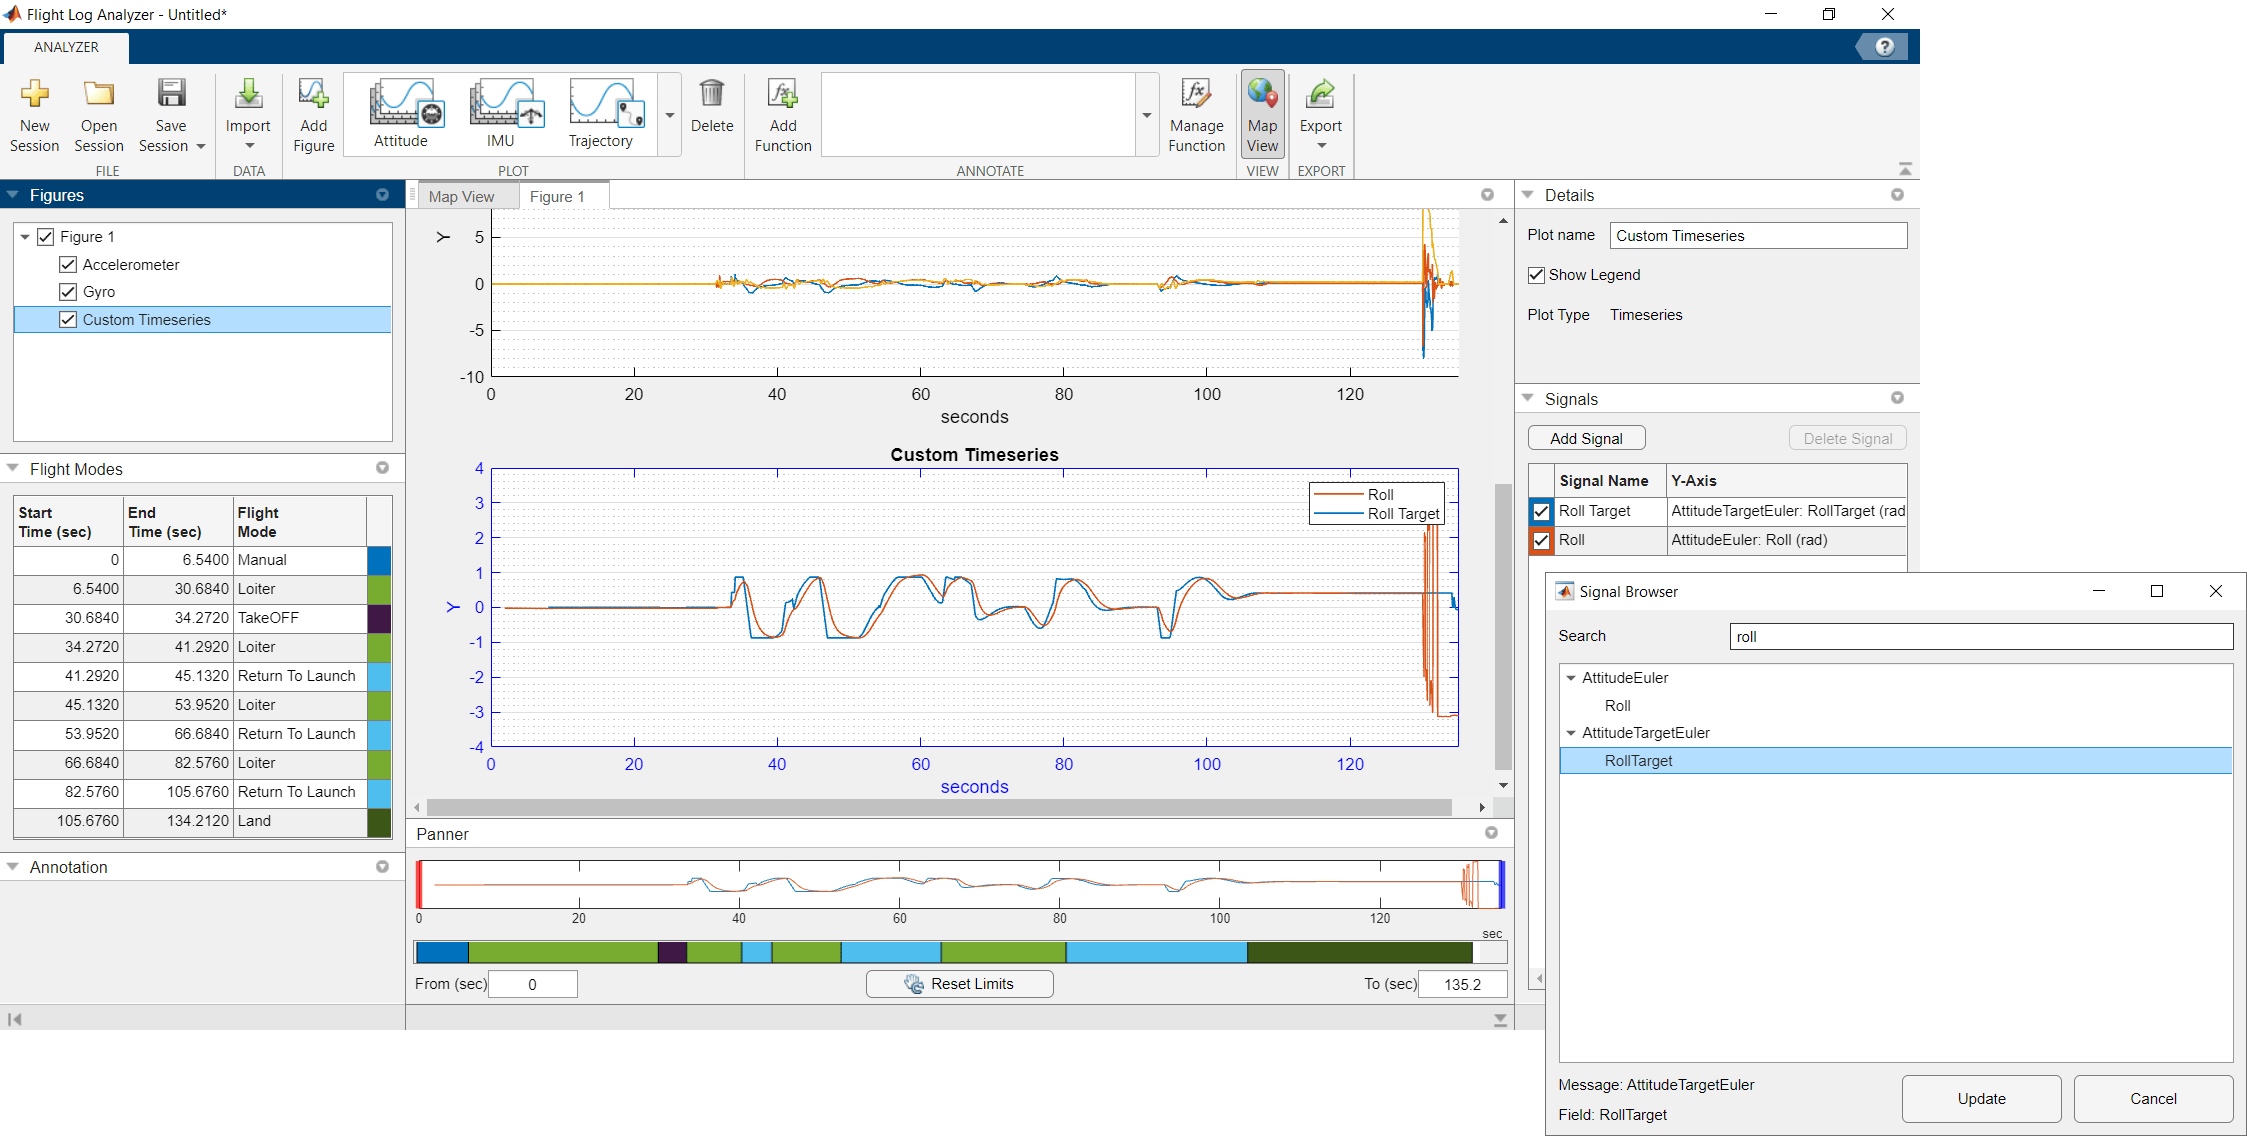
Next, create a custom Timeseries plot to compare the estimated roll against the roll target.
First, in the Custom Plots section of the plot gallery, click Timeseries.
In the Signals pane, click Add Signal twice to add two signals.
Double-click the Y-Axis column of the first signal and, in the Signal Browser window, type
RollTargetin the Search box, and then click the arrow next toAttitudeTargetEulerand selectRollTarget. Then, click Update.Repeat the previous three steps for the second signal to add
Roll.Rename the first signal to
Roll Targetand the second signal toRoll. To rename a signal, double-click its entry in the Signal Name column and type the new name.In the Details pane, select Show Legend to show the legend on the plot.
The plot shows that the estimated roll closely follows the roll target until the last few seconds of the flight.
Export Signals
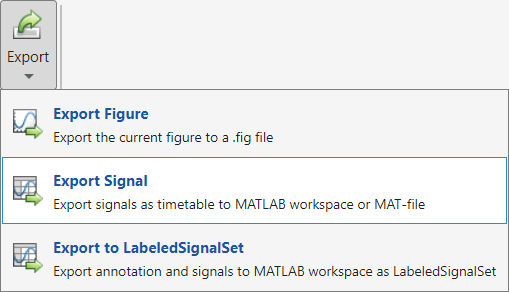
Select Export > Export Signal to export the signals as a timetable to the MATLAB workspace or a MAT file (.mat).
Select the signals to export. To export to a MAT file, select To MAT-file, specify a file name, and optionally click Browse to choose a destination folder.
To export the signals to the MATLAB workspace, select To MATLAB workspace and specify a name for the output workspace variable.
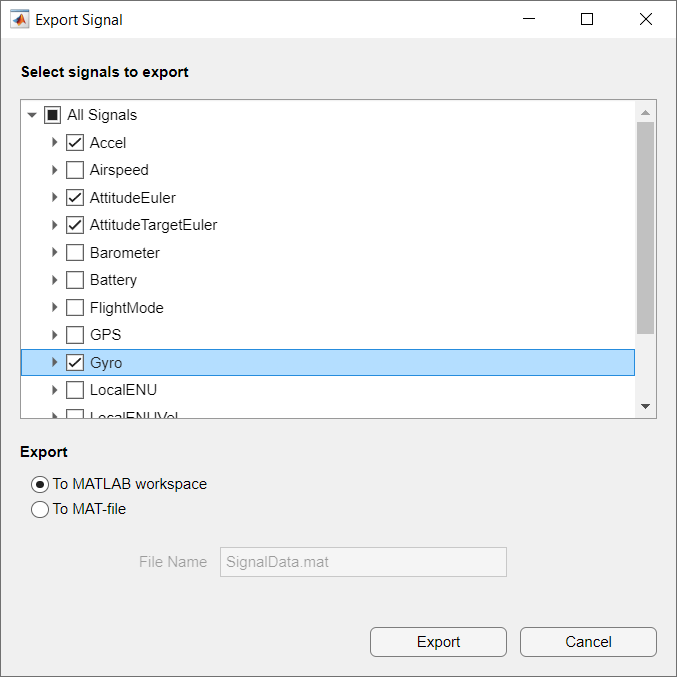
The app exports the signals as a timetable.
Use Custom Signal Mapping in Flight Log Analyzer App
The default signal mapping includes a predefined set of signals.
flsmObj = flightLogSignalMapping("ulog");
info(flsmObj,"Signal")
ans = 38×4 table
               SignalName                IsMapped                                                                                                                                     SignalFields                                                                                                                                                                                FieldUnits
    _________________________________    ________    ______________________________________________________________________________________________________________________________________________________________________________________________________________________________________________________________________________    ________________________________________________________________________________________________

    "Accel"                               true       "AccelX, AccelY, AccelZ"                                                                                                                                                                                                                                                          "m/s^2, m/s^2, m/s^2"
    "Airspeed"                            true       "PressDiff, IndicatedAirSpeed, Temperature"                                                                                                                                                                                                                                       "Pa, m/s, degreeC"
    "AttitudeEuler"                       true       "Roll, Pitch, Yaw"                                                                                                                                                                                                                                                                "rad, rad, rad"
    "AttitudeRate"                        true       "BodyRotationRateX, BodyRotationRateY, BodyRotationRateZ"                                                                                                                                                                                                                         "rad/s, rad/s, rad/s"
    "AttitudeTargetEuler"                 true       "RollTarget, PitchTarget, YawTarget"                                                                                                                                                                                                                                              "rad, rad, rad"
    "Barometer"                           true       "PressAbs, PressAltitude, Temperature"                                                                                                                                                                                                                                            "Pa, m, degreeC"
    "Battery"                             true       "Voltage_1, Voltage_2, Voltage_3, Voltage_4, Voltage_5, Voltage_6, Voltage_7, Voltage_8, Voltage_9, Voltage_10, Voltage_11, Voltage_12, Voltage_13, Voltage_14, Voltage_15, Voltage_16, RemainingCapacity"                                                                        "v, v, v, v, v, v, v, v, v, v, v, v, v, v, v, v, %"
    "EstimatorInnovationAirspeed"         true       "Airspeed, Var_Airspeed"                                                                                                                                                                                                                                                          "m/s, (m/s)^2"
    "EstimatorInnovationGPS"              true       "V_X, V_Y, V_Z, P_X, P_Y, P_Z, Var_V_X, Var_V_Y, Var_V_Z, Var_P_X, Var_P_Y, Var_P_Z"                                                                                                                                                                                              "m/s, m/s, m/s, m, m, m, (m/s)^2, (m/s)^2, (m/s)^2, m^2, m^2, m^2"
    "EstimatorInnovationHeading"          true       "Heading, Var_Heading"                                                                                                                                                                                                                                                            "rad, rad^2"
    "EstimatorInnovationHeight"           true       "RangeHeight, BaroHeight, Var_RangeHeight, Var_BaroHeight"                                                                                                                                                                                                                        "m, m, m^2, m^2"
    "EstimatorInnovationMagnetometer"     true       "X, Y, Z, Var_X, Var_Y, Var_Z"                                                                                                                                                                                                                                                    "Gauss, Gauss, Gauss, Gauss^2, Gauss^2, Gauss^2"
    "EstimatorInnovationOpticalFlow"      true       "X, Y, Var_X, Var_Y"                                                                                                                                                                                                                                                              "rad/sec, rad/sec, (rad/sec)^2, (rad/sec)^2"
    "EstimatorStatesIMUBias"              true       "DeltaAngleBiasX, DeltaAngleBiasY, DeltaAngleBiasZ, DeltaVelocityBiasX, DeltaVelocityBiasY, DeltaVelocityBiasZ, Var_DeltaAngleBiasX, Var_DeltaAngleBiasY, Var_DeltaAngleBiasZ, Var_DeltaVelocityBiasX, Var_DeltaVelocityBiasY, Var_DeltaVelocityBiasZ"                            "rad, rad, rad, m/s, m/s, m/s, rad^2, rad^2, rad^2, (m/s)^2, (m/s)^2, (m/s)^2"
    "EstimatorStatesMagnetometerBias"     true       "EarthMagneticFieldN, EarthMagneticFieldE, EarthMagneticFieldD, BodyMagneticFieldX, BodyMagneticFieldY, BodyMagneticFieldZ, Var_EarthMagneticFieldN, Var_EarthMagneticFieldE, Var_EarthMagneticFieldD, Var_BodyMagneticFieldX, Var_BodyMagneticFieldY, Var_BodyMagneticFieldZ"    "Gauss, Gauss, Gauss, Gauss, Gauss, Gauss, Gauss^2, Gauss^2, Gauss^2, Gauss^2, Gauss^2, Gauss^2"
    "EstimatorStatesWind"                 true       "WindNorth, WindEast, Var_WindNorth, Var_WindEast"                                                                                                                                                                                                                                "m/s, m/s, (m/s)^2, (m/s)^2"
      ⋮
In addition to the predefined signals, you can map other signals present in the flight log. For example, use mapSignal to map WindSpeed to the flightLogSignalMapping object flsmObj.
% Map WindSpeed signal from the wind_estimate topic
timeFcn = @(data) getTime(getTable(data,"wind_estimate"));
valueFcn = @(data) getModeValue(getTable(data,"wind_estimate"));
mapSignal(flsmObj,"WindSpeed",timeFcn,valueFcn, ...
    ["WindSpeed_East","WindSpeed_North"]);
Verify that flsmObj now contains the new signal.
info(flsmObj,"Signal")ans = 39×4 table
SignalName IsMapped SignalFields FieldUnits
_________________________________ ________ ______________________________________________________________________________________________________________________________________________________________________________________________________________________________________________________________________________ ________________________________________________________________________________________________
"Accel" true "AccelX, AccelY, AccelZ" "m/s^2, m/s^2, m/s^2"
"Airspeed" true "PressDiff, IndicatedAirSpeed, Temperature" "Pa, m/s, degreeC"
"AttitudeEuler" true "Roll, Pitch, Yaw" "rad, rad, rad"
"AttitudeRate" true "BodyRotationRateX, BodyRotationRateY, BodyRotationRateZ" "rad/s, rad/s, rad/s"
"AttitudeTargetEuler" true "RollTarget, PitchTarget, YawTarget" "rad, rad, rad"
"Barometer" true "PressAbs, PressAltitude, Temperature" "Pa, m, degreeC"
"Battery" true "Voltage_1, Voltage_2, Voltage_3, Voltage_4, Voltage_5, Voltage_6, Voltage_7, Voltage_8, Voltage_9, Voltage_10, Voltage_11, Voltage_12, Voltage_13, Voltage_14, Voltage_15, Voltage_16, RemainingCapacity" "v, v, v, v, v, v, v, v, v, v, v, v, v, v, v, v, %"
"EstimatorInnovationAirspeed" true "Airspeed, Var_Airspeed" "m/s, (m/s)^2"
"EstimatorInnovationGPS" true "V_X, V_Y, V_Z, P_X, P_Y, P_Z, Var_V_X, Var_V_Y, Var_V_Z, Var_P_X, Var_P_Y, Var_P_Z" "m/s, m/s, m/s, m, m, m, (m/s)^2, (m/s)^2, (m/s)^2, m^2, m^2, m^2"
"EstimatorInnovationHeading" true "Heading, Var_Heading" "rad, rad^2"
"EstimatorInnovationHeight" true "RangeHeight, BaroHeight, Var_RangeHeight, Var_BaroHeight" "m, m, m^2, m^2"
"EstimatorInnovationMagnetometer" true "X, Y, Z, Var_X, Var_Y, Var_Z" "Gauss, Gauss, Gauss, Gauss^2, Gauss^2, Gauss^2"
"EstimatorInnovationOpticalFlow" true "X, Y, Var_X, Var_Y" "rad/sec, rad/sec, (rad/sec)^2, (rad/sec)^2"
"EstimatorStatesIMUBias" true "DeltaAngleBiasX, DeltaAngleBiasY, DeltaAngleBiasZ, DeltaVelocityBiasX, DeltaVelocityBiasY, DeltaVelocityBiasZ, Var_DeltaAngleBiasX, Var_DeltaAngleBiasY, Var_DeltaAngleBiasZ, Var_DeltaVelocityBiasX, Var_DeltaVelocityBiasY, Var_DeltaVelocityBiasZ" "rad, rad, rad, m/s, m/s, m/s, rad^2, rad^2, rad^2, (m/s)^2, (m/s)^2, (m/s)^2"
"EstimatorStatesMagnetometerBias" true "EarthMagneticFieldN, EarthMagneticFieldE, EarthMagneticFieldD, BodyMagneticFieldX, BodyMagneticFieldY, BodyMagneticFieldZ, Var_EarthMagneticFieldN, Var_EarthMagneticFieldE, Var_EarthMagneticFieldD, Var_BodyMagneticFieldX, Var_BodyMagneticFieldY, Var_BodyMagneticFieldZ" "Gauss, Gauss, Gauss, Gauss, Gauss, Gauss, Gauss^2, Gauss^2, Gauss^2, Gauss^2, Gauss^2, Gauss^2"
"EstimatorStatesWind" true "WindNorth, WindEast, Var_WindNorth, Var_WindEast" "m/s, m/s, (m/s)^2, (m/s)^2"
⋮
To use this custom signal mapping in the Flight Log Analyzer app:
On the app toolstrip, click Import and select From Workspace.
In the dialog box, select
flsmObjfrom the Signal Mapping list.Select the
ulogreaderobjectulgfrom the Log Data section.Click Import.
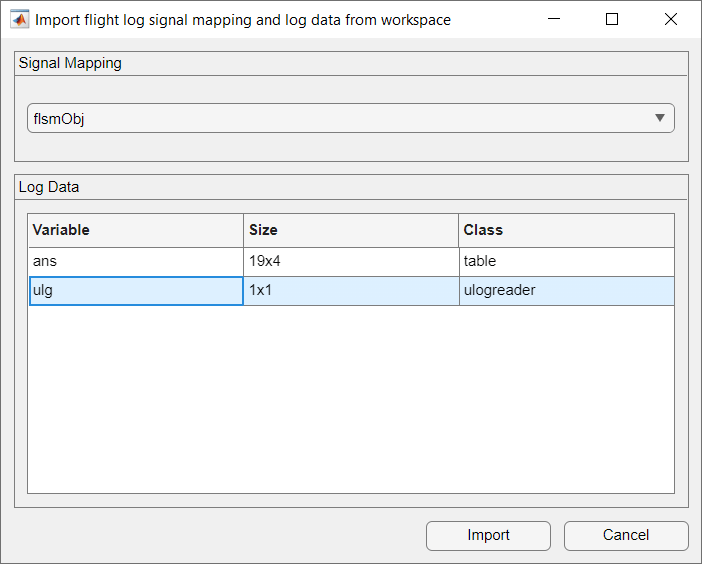
Create a custom Timeseries plot and follow the steps in Add Custom Plot to add the WindSpeed_East and WindSpeed_North signals from the Signal Browser.
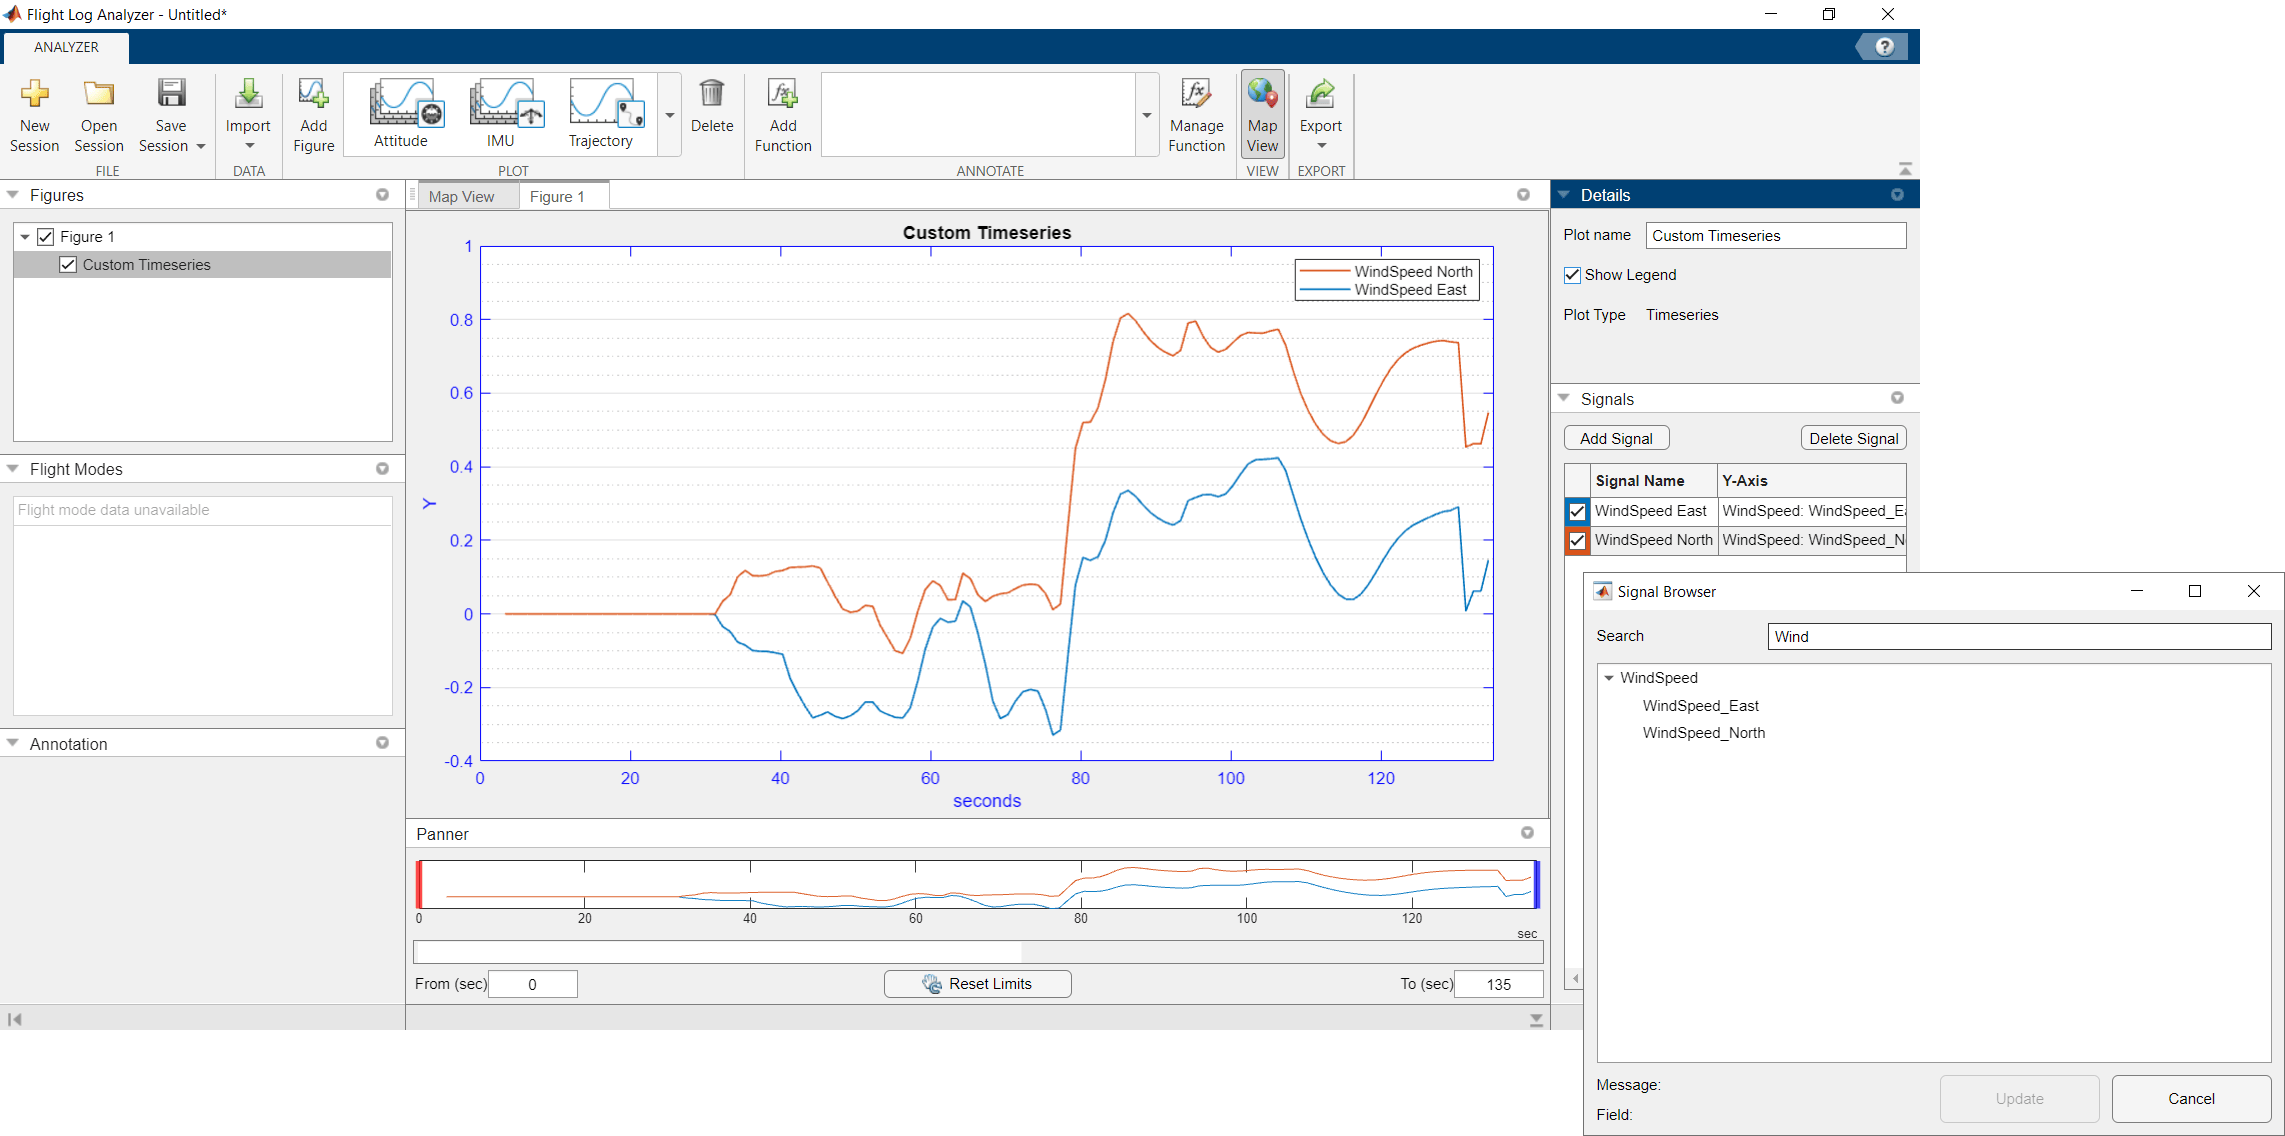
Use this process to map additional signals to the custom signal mapping object and visualize them in the app.
References
[1] PX4 Autopilot. "Flight Log Analysis." PX4 User Guide. Accessed July 9, 2026. https://docs.px4.io/main/en/log/flight_log_analysis.html
[2] PX4 Autopilot. "Log Analysis Using Flight Review." PX4 User Guide. Accessed July 9, 2026. https://docs.px4.io/main/en/log/flight_review.html
See Also
mavlinktlog | ulogreader | ardupilotreader

