各種分類器の決定面の可視化
この例では、各種の分類アルゴリズムの決定面をプロットする方法を示します。
フィッシャーのアヤメのデータ セットを読み込みます。
load fisheriris
X = meas(:,1:2);
y = categorical(species);
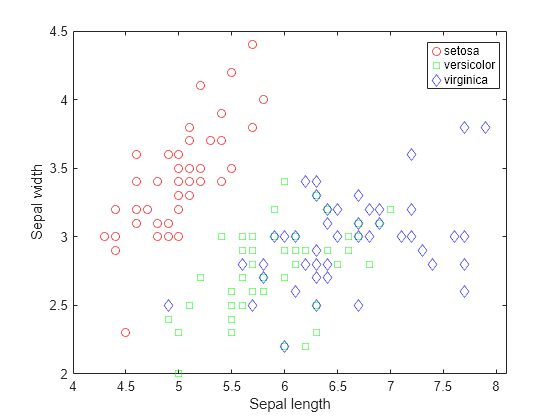
labels = categories(y);X は、150 本のアヤメについて 2 つのがく片の測定値が含まれている数値行列です。Y は、対応するアヤメの種類が含まれている文字ベクトルの cell 配列です。
散布図を使用してデータを可視化します。アヤメの種類によって変数をグループ化します。
gscatter(X(:,1),X(:,2),species,'rgb','osd');
xlabel('Sepal length');
ylabel('Sepal width');
4 つの異なる分類器に学習をさせ、モデルを cell 配列に格納します。
classifier_name = {'Naive Bayes','Discriminant Analysis','Classification Tree','Nearest Neighbor'};単純ベイズ モデルに学習をさせます。
classifier{1} = fitcnb(X,y);判別分析分類器を学習させます。
classifier{2} = fitcdiscr(X,y);分類決定木に学習をさせます。
classifier{3} = fitctree(X,y);k 最近傍分類器に学習をさせます。
classifier{4} = fitcknn(X,y);実際のデータ値の境界内で空間全体に広がる点のグリッドを作成します。
x1range = min(X(:,1)):.01:max(X(:,1));
x2range = min(X(:,2)):.01:max(X(:,2));
[xx1, xx2] = meshgrid(x1range,x2range);
XGrid = [xx1(:) xx2(:)];
すべての分類器を使用して、XGrid 内の各観測値についてアヤメの種類を予測します。結果の散布図をプロットします。
for i = 1:numel(classifier)
   predictedspecies = predict(classifier{i},XGrid);

   subplot(2,2,i);
   gscatter(xx1(:), xx2(:), predictedspecies,'rgb');

   title(classifier_name{i})
   legend off, axis tight
end

legend(labels,'Location',[0.35,0.01,0.35,0.05],'Orientation','Horizontal')
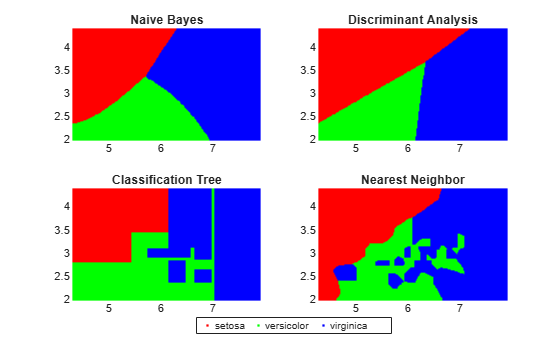
各分類アルゴリズムで異なる決定ルールが生成されます。決定面は、これらのルールの可視化に役立ちます。