onehotdecode
説明
A = onehotdecode(B,classes,featureDim)B 内の各確率ベクトルを、classes で指定されたラベルのうち確率が最も高いクラス ラベルに復号化します。featureDim は、確率ベクトルの定義に使用される次元を指定します。この関数は、ベクトル内で最も高い値がある位置と、classes 内でそれに対応する位置にあるクラス ラベルをマッチングさせて、確率ベクトルをクラス ラベルに復号化します。A 内の各確率ベクトルは、確率ベクトル内で最も高い値に対応する classes の値に置き換えられます。
例
ラベルのセットを確率ベクトルに符号化し、それらを復号化してラベルに戻します。
色の種類を指定する categorical ラベルのベクトルを作成します。
colorsOriginal = ["red","blue","red","green","yellow","blue"];
colorsOriginal = categorical(colorsOriginal)
colorsOriginal = 1×6 categorical
     red      blue      red      green      yellow      blue
categorical ベクトルのクラスを調べます。
classes = categories(colorsOriginal)
classes = 4×1 cell
    {'blue'  }
    {'green' }
    {'red'   }
    {'yellow'}
関数 onehotencode を使用して、ラベルを確率ベクトルに one-hot 符号化します。各行がクラスに対応し、各列が確率ベクトルに対応するように、最初の次元にラベルを符号化します。
colorsEncoded = onehotencode(colorsOriginal,1)
colorsEncoded = 4×6

     0     1     0     0     0     1
     0     0     0     1     0     0
     1     0     1     0     0     0
     0     0     0     0     1     0
関数 onehotdecode を使用して、確率ベクトルを復号化します。
colorsDecoded = onehotdecode(colorsEncoded,classes,1)
colorsDecoded = 1×6 categorical
     red      blue      red      green      yellow      blue
復号化されたラベルは元のラベルと一致します。
ダミー変数を作成し、元のデータに復号化します。
色の種類を指定して、カテゴリカル データの列ベクトルを作成します。
colorsOriginal = ["red";"blue";"red";"green";"yellow";"blue"];
colorsOriginal = categorical(colorsOriginal)
colorsOriginal = 6×1 categorical
     red
     blue
     red
     green
     yellow
     blue
categorical ベクトルのクラスを調べます。
classes = categories(colorsOriginal);
関数 dummyvar を使用して、色の種類のそれぞれにダミー変数を作成します。
dummyColors = dummyvar(colorsOriginal)
dummyColors = 6×4

     0     0     1     0
     1     0     0     0
     0     0     1     0
     0     1     0     0
     0     0     0     1
     1     0     0     0
関数 onehotdecode を使用して、2 番目の次元のダミー変数を復号化します。
colorsDecoded = onehotdecode(dummyColors,classes,2)
colorsDecoded = 6×1 categorical
     red
     blue
     red
     green
     yellow
     blue
復号化された変数は、元の色の種類と一致します。
確率ベクトルのセットを各観測値に対する最も確率の高いクラスに復号化します。
10 個のランダムな確率ベクトルのセットを作成します。このベクトルは、観測値が 5 個のクラスのいずれかに属する確率を表します。
numObs = 10;
numClasses = 5;

prob = rand(numObs,numClasses);

tot = sum(prob,2);
prob = prob./tot
prob = 10×5

    0.2938    0.0568    0.2365    0.2546    0.1582
    0.3895    0.4174    0.0154    0.0137    0.1641
    0.0427    0.3217    0.2854    0.0931    0.2573
    0.2878    0.1529    0.2943    0.0145    0.2505
    0.2640    0.3341    0.2834    0.0405    0.0780
    0.0422    0.0614    0.3280    0.3564    0.2120
    0.1078    0.1632    0.2876    0.2689    0.1725
    0.1940    0.3249    0.1392    0.1125    0.2293
    0.2356    0.1949    0.1613    0.2338    0.1745
    0.3345    0.3326    0.0593    0.0119    0.2616
5 つのクラスのセットを定義します。
classes = ["Red","Yellow","Green","Blue","Purple"];
関数 onehotdecode を使用して、最も確率の高いクラスに確率を復号化します。確率ベクトルは 2 番目の次元 (各列が一意のクラスに対応) に符号化されているため、符号化された確率を含む次元を 2 と指定します。最も確率の高いクラスを string ベクトルとして取得します。
result = onehotdecode(prob,classes,2,"string")result = 10×1 string
"Red"
"Yellow"
"Yellow"
"Green"
"Yellow"
"Blue"
"Green"
"Yellow"
"Red"
"Red"
予測クラス スコアを予測ラベルに復号化します。
fisheriris データ セットを読み込みます。150 本のアヤメについて 4 つの測定値が含まれる数値行列 X を作成します。対応するアヤメの種類が含まれる categorical ラベルのベクトル S を作成します。
load fisheriris
X = meas;
S = categorical(species);
関数 onehotencode を使用して、ラベルを確率ベクトルに one-hot 符号化します。確率ベクトルを 2 番目の次元に符号化します。
Y = onehotencode(S,2);
単純な線形分類器の近似係数を計算します。
B = X\Y
B = 4×3

    0.0834    0.2117   -0.1481
    0.2533   -0.3059    0.1412
   -0.2270    0.1888    0.0181
   -0.0635   -0.5749    0.5873
近似係数からクラス スコアを予測し、スコアが範囲 [0,1] に収まっていることを確認します。
scores = X*B;
scores = min(1,max(0,scores));
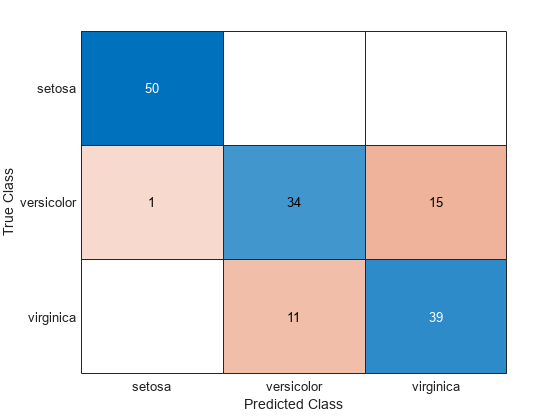
関数 onehotdecode を使用して、予測クラス スコアを予測ラベルに復号化します。その後、混同チャートを作成して、真のラベル S を予測ラベル label と比較します。
label = onehotdecode(scores,categories(S),2);
confusionchart(S,label)
入力引数
出力引数
バージョン履歴
R2021b で導入