アンサンブル品質テスト
アンサンブルの予測品質を学習データでの性能に基づいて評価することはできません。アンサンブルには "過学習" の傾向があり、予測力の推定が過度に楽観的になります。つまり、分類の場合のresubLoss (回帰の場合はresubLoss) の結果では通常、新しいデータの場合より誤差が小さくなります。
アンサンブル品質をより正確に把握できるようにするには、次のいずれかの方式を使用します。
独立したテスト セットでアンサンブルを評価します (十分な学習データがあるときに適しています)。
交差検証によってアンサンブルを評価します (十分な学習データがないときに適しています)。
out-of-bag データでアンサンブルを評価します (バギング アンサンブルを
fitcensembleまたはfitrensembleで作成する場合に適しています)。
この例では、アンサンブル品質を評価する 3 つの方式をすべて使用できるように、バギング アンサンブルを使用します。
20 の予測子を指定して人為的なデータセットを生成します。各エントリは 0 ~ 1 の乱数です。初期分類は、 の場合は 、それ以外の場合は です。
rng(1,'twister') % For reproducibility
X = rand(2000,20);
Y = sum(X(:,1:5),2) > 2.5;
さらに、結果にノイズを追加するため、分類の 10% をランダムに入れ替えます。
idx = randsample(2000,200);
Y(idx) = ~Y(idx);
独立したテスト セット
独立した学習セットとテスト セットのデータを作成します。holdout オプションを使用して cvpartition を呼び出すことにより、データの 70% を学習セットに使用します。
cvpart = cvpartition(Y,'holdout',0.3);
Xtrain = X(training(cvpart),:);
Ytrain = Y(training(cvpart),:);
Xtest = X(test(cvpart),:);
Ytest = Y(test(cvpart),:);
学習データから、200 本の木によるバギング分類アンサンブルを作成します。
t = templateTree('Reproducible',true);  % For reproducibility of random predictor selections
bag = fitcensemble(Xtrain,Ytrain,'Method','Bag','NumLearningCycles',200,'Learners',t)
bag =
  ClassificationBaggedEnsemble
             ResponseName: 'Y'
    CategoricalPredictors: []
               ClassNames: [0 1]
           ScoreTransform: 'none'
          NumObservations: 1400
               NumTrained: 200
                   Method: 'Bag'
             LearnerNames: {'Tree'}
     ReasonForTermination: 'Terminated normally after completing the requested number of training cycles.'
                  FitInfo: []
       FitInfoDescription: 'None'
                FResample: 1
                  Replace: 1
         UseObsForLearner: [1400×200 logical]


  Properties, Methods
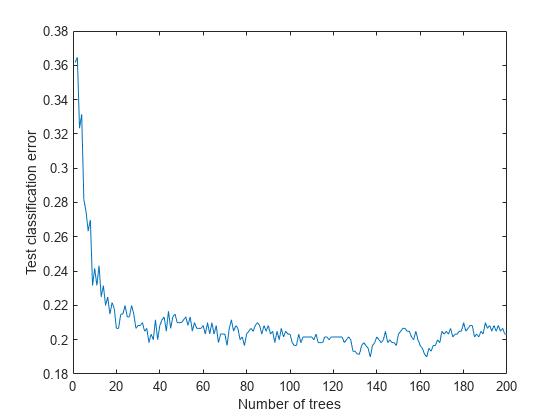
テスト データの損失 (誤分類) をアンサンブルに含まれている学習済みの木の本数の関数としてプロットします。
figure
plot(loss(bag,Xtest,Ytest,'mode','cumulative'))
xlabel('Number of trees')
ylabel('Test classification error')
交差検証
5 分割交差検証された、バギング アンサンブルを生成します。
cv = fitcensemble(X,Y,'Method','Bag','NumLearningCycles',200,'Kfold',5,'Learners',t)
cv =
  ClassificationPartitionedEnsemble
    CrossValidatedModel: 'Bag'
         PredictorNames: {'x1'  'x2'  'x3'  'x4'  'x5'  'x6'  'x7'  'x8'  'x9'  'x10'  'x11'  'x12'  'x13'  'x14'  'x15'  'x16'  'x17'  'x18'  'x19'  'x20'}
           ResponseName: 'Y'
        NumObservations: 2000
                  KFold: 5
              Partition: [1×1 cvpartition]
      NumTrainedPerFold: [200 200 200 200 200]
             ClassNames: [0 1]
         ScoreTransform: 'none'


  Properties, Methods
交差検証損失をアンサンブル内の木の本数の関数として調べます。
figure
plot(loss(bag,Xtest,Ytest,'mode','cumulative'))
hold on
plot(kfoldLoss(cv,'mode','cumulative'),'r.')
hold off
xlabel('Number of trees')
ylabel('Classification error')
legend('Test','Cross-validation','Location','NE')
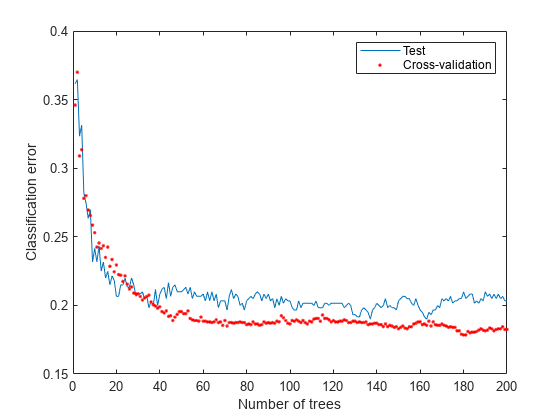
交差検証により、独立集合の場合と同等の推定値が得られます。
out-of-bag 推定
out-of-bag 推定の損失曲線を生成し、他の曲線と共にプロットします。
figure
plot(loss(bag,Xtest,Ytest,'mode','cumulative'))
hold on
plot(kfoldLoss(cv,'mode','cumulative'),'r.')
plot(oobLoss(bag,'mode','cumulative'),'k--')
hold off
xlabel('Number of trees')
ylabel('Classification error')
legend('Test','Cross-validation','Out of bag','Location','NE')
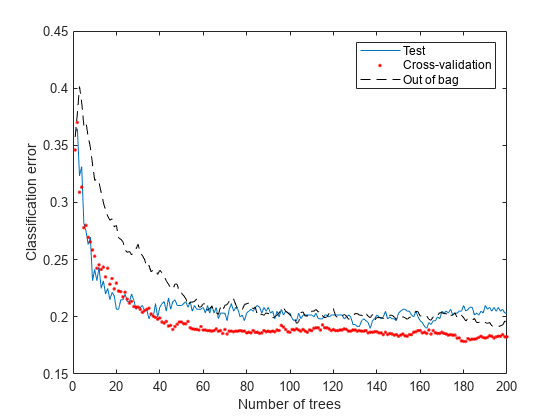
out-of-bag 推定でも、他の手法と同等の結果が示されています。
参考
fitcensemble | fitrensemble | resubLoss | resubLoss | cvpartition | oobLoss | kfoldLoss | loss