gagerr
R2026bゲージの繰り返し性と再現性の分析
構文
説明
gagerr(___, では、前の構文におけるいずれかの入力引数の組み合わせに加えて、1 つ以上の名前と値の引数を使用してオプションを指定します。たとえば、結果の棒グラフを表示するかどうかを指定したり、精度-許容誤差の比 (PTR) の計算の仕様限界を設定したりできます。Name=Value)
results = gagerr(___)results で返します。tbl または OutputFormat="table" を指定した場合、results は table になります。それ以外の場合、results は行列になります。
例
3 つの部品の 100 個の測定値 y を無作為に生成して測定データ セットのシミュレーションを実行します。各測定値は 4 人のうちの無作為に割り当てられた 1 人の作業者によって収集されます。
rng(1234,"twister"); % For reproducibility
n = 100;
y = randn(n,1);
part = randi([1,3],1,n);
operator = randi([1,4],1,n);
このデータ セットに対して、交互作用のない混合 ANOVA モデルを使用してゲージの繰り返し性と再現性 (R&R) の分析を実行します。
gagerr(y,{part,operator},RandomOperator=false) Source Variance PercentVariance Sigma StudyVariation PercentStudyVariation
_________________ _________ _______________ _______ ______________ _____________________
Gage R&R 0.95348 99.251 0.97646 5.0288 99.625
Repeatability 0.95348 99.251 0.97646 5.0288 99.625
Reproducibility 0 0 0 0 0
Part 0.0071911 0.74854 0.0848 0.43672 8.6518
Total 0.96067 100 0.98014 5.0477
Study Variation: 5.15*Sigma
Number of distinct categories (NDC):0
% of Gage R&R of total variations (PRR): 99.63
Note: The last column of the above table does not have to sum to 100%
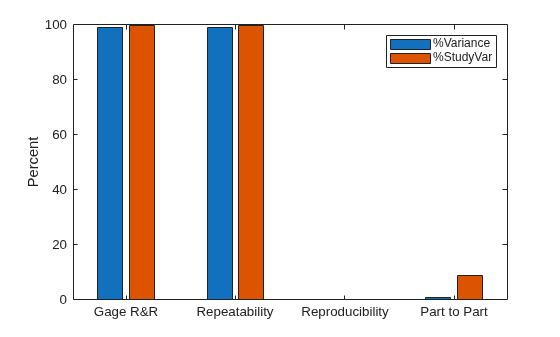
分析結果を要約した情報と棒グラフが表示されます。table の各行に、測定データにおける変動性のそれぞれ異なる原因に関する統計が格納されています。このデータ セットでは、変動性の主たる原因は繰り返し性 (同じ部品に関して同じ作業者から得られる測定値の変動) です。この原因が測定値の全分散の 99.25%、および測定値の全標準偏差の 99.63% を占めています。異なるカテゴリ数は 0 であり、測定システムで測定データ内のいずれのグループも区別できないことを示しています。
A、B、C という 3 人の作業者による 5 つの部品についての 100 個の測定値 y を無作為に生成して測定データ セットのシミュレーションを実行します。それぞれの部品の測定は 1 人の作業者のみが行います。
rng(1234,"twister"); % For reproducibility
n = 100;
y = randn(n,1);
parts = randi(5,1,n)';
operatorName = ["A","B","C","A","A"];
operators = operatorName(parts)';
tbl = table(y,parts,operators, ...
    VariableNames=["y","Part","Operator"]);
データ セットの先頭の数行を表示します。
head(tbl)
       y        Part    Operator
    ________    ____    ________

    -0.94725     1        "A"
     0.54015     3        "C"
     -0.2166     1        "A"
       1.189     5        "A"
       1.317     2        "B"
    -0.40563     1        "A"
    -0.44491     3        "C"
      1.3284     5        "A"
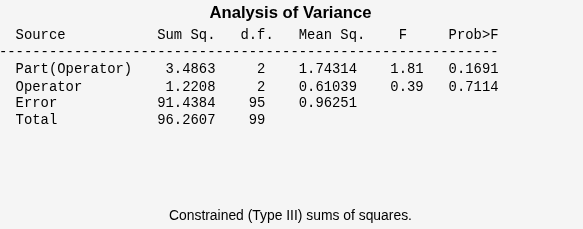
このデータ セットに対して、Part が Operator 内で入れ子になった混合 ANOVA モデルを使用してゲージの繰り返し性と再現性 (R&R) の分析を実行します。ANOVA 表を Figure に表示し、SigmaMultiplier=6 を設定してシックスシグマ分析を実行します。
gagerr(tbl,"y","Part","Operator",Model="part-nested", ...
    DisplayANOVA="on",SigmaMultiplier=6)
         Source          Variance    PercentVariance     Sigma     StudyVariation    PercentStudyVariation
    _________________    ________    _______________    _______    ______________    _____________________

    Gage R&R              0.96251        96.475         0.98108        5.8865               98.221
      Repeatability       0.96251        96.475         0.98108        5.8865               98.221
      Reproducibility           0             0               0             0                    0
    Part                 0.035173        3.5255         0.18754        1.1253               18.776
    Total                 0.99768           100         0.99884         5.993

Study Variation: 6.00*Sigma
Number of distinct categories (NDC):0
% of Gage R&R of total variations (PRR): 98.22
Note: The last column of the above table does not have to sum to 100%
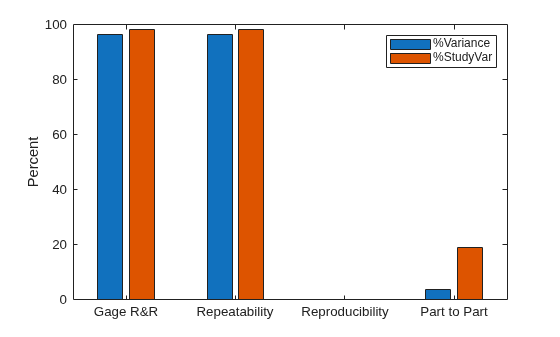
分析結果を要約した情報と棒グラフが表示されます。table の各行に、測定データにおける変動性のそれぞれ異なる原因に関する統計が格納されています。このデータ セットでは、変動性の主たる原因は繰り返し性 (同じ部品に関して同じ作業者から得られる測定値の変動) です。この原因が測定値の全分散の 96.475%、および測定値の全標準偏差の 98.1% を占めています。異なるカテゴリ数は 0 であり、測定システムで測定データ内のいずれのグループも区別できないことを示しています。
入力引数
名前と値の引数
出力引数
詳細
代替機能
gagerr を使用する代わりに、ゲージ R&R アナライザー アプリを使用してゲージ R&R 分析を対話的に実行できます。このアプリには、ゲージ棒グラフ、ボックス チャート、管理図、変動性図など、測定データや R&R の結果を可視化する方法が複数用意されています。
参照
[1] Burdick, Richard K., Connie M. Borror, and Douglas C. Montgomery. Design and Analysis of Gauge R&R Studies: Making Decisions with Confidence Intervals in Random and Mixed ANOVA Models. ASA-SIAM Series on Statistics and Applied Probability. Philadelphia, Pa. : Alexandria, Va: Society for Industrial Applied Mathematics ; American Statistical Association, 2005.

