FeatureTransformer
生成された特徴変換
説明
作成
関数 gencfeatures または genrfeatures を使用して FeatureTransformer オブジェクトを作成します。
プロパティ
例
genrfeatures を使用して予測子データの table から特徴量を生成します。生成された特徴量をオブジェクト関数 describe を使用して調べます。
停電のデータをワークスペースに table として読み込みます。欠損値がある観測値を削除し、table の最初の数行を表示します。
outages = readtable("outages.csv");
Tbl = rmmissing(outages);
head(Tbl)
Region OutageTime Loss Customers RestorationTime Cause
_____________ ________________ ______ __________ ________________ ___________________
{'SouthWest'} 2002-02-01 12:18 458.98 1.8202e+06 2002-02-07 16:50 {'winter storm' }
{'SouthEast'} 2003-02-07 21:15 289.4 1.4294e+05 2003-02-17 08:14 {'winter storm' }
{'West' } 2004-04-06 05:44 434.81 3.4037e+05 2004-04-06 06:10 {'equipment fault'}
{'MidWest' } 2002-03-16 06:18 186.44 2.1275e+05 2002-03-18 23:23 {'severe storm' }
{'West' } 2003-06-18 02:49 0 0 2003-06-18 10:54 {'attack' }
{'NorthEast'} 2003-07-16 16:23 239.93 49434 2003-07-17 01:12 {'fire' }
{'MidWest' } 2004-09-27 11:09 286.72 66104 2004-09-27 16:37 {'equipment fault'}
{'SouthEast'} 2004-09-05 17:48 73.387 36073 2004-09-05 20:46 {'equipment fault'}
変数の中には、OutageTime や RestorationTime など、fitrensemble のような回帰モデル学習関数でサポートされないデータ型の変数も含まれています。
Tbl 内の予測子から、バギング アンサンブルの学習に使用できる特徴量を 25 個生成します。table 変数 Loss を応答として指定します。
rng("default") % For reproducibility
Transformer = genrfeatures(Tbl,"Loss",25,TargetLearner="bag")
Transformer =
  FeatureTransformer with properties:

                     Type: 'regression'
            TargetLearner: 'bag'
    NumEngineeredFeatures: 22
      NumOriginalFeatures: 3
         TotalNumFeatures: 25
Transformer オブジェクトに、生成された特徴量とそれらの作成に使用された変換に関する情報が格納されます。
生成された特徴量について詳しく確認するには、オブジェクト関数 describe を使用します。
Info = describe(Transformer)
Info=25×4 table
                                     Type        IsOriginal          InputVariables                                     Transformations
                                  ___________    __________    ___________________________    ___________________________________________________________________

    c(Region)                     Categorical      true        Region                         "Variable of type categorical converted from a cell data type"
    Customers                     Numeric          true        Customers                      ""
    c(Cause)                      Categorical      true        Cause                          "Variable of type categorical converted from a cell data type"
    kmd2                          Numeric          false       Customers                      "Euclidean distance to centroid 2 (kmeans clustering with k = 10)"
    kmd1                          Numeric          false       Customers                      "Euclidean distance to centroid 1 (kmeans clustering with k = 10)"
    kmd4                          Numeric          false       Customers                      "Euclidean distance to centroid 4 (kmeans clustering with k = 10)"
    kmd5                          Numeric          false       Customers                      "Euclidean distance to centroid 5 (kmeans clustering with k = 10)"
    kmd9                          Numeric          false       Customers                      "Euclidean distance to centroid 9 (kmeans clustering with k = 10)"
    cos(Customers)                Numeric          false       Customers                      "cos( )"
    RestorationTime-OutageTime    Numeric          false       OutageTime, RestorationTime    "Elapsed time in seconds between OutageTime and RestorationTime"
    kmd6                          Numeric          false       Customers                      "Euclidean distance to centroid 6 (kmeans clustering with k = 10)"
    kmi                           Categorical      false       Customers                      "Cluster index encoding (kmeans clustering with k = 10)"
    kmd7                          Numeric          false       Customers                      "Euclidean distance to centroid 7 (kmeans clustering with k = 10)"
    kmd3                          Numeric          false       Customers                      "Euclidean distance to centroid 3 (kmeans clustering with k = 10)"
    kmd10                         Numeric          false       Customers                      "Euclidean distance to centroid 10 (kmeans clustering with k = 10)"
    hour(RestorationTime)         Numeric          false       RestorationTime                "Hour of the day"
      ⋮
生成された最初の 3 つの特徴量は Tbl が元になっています。このうち、変数 categorical は、元の変数 Region および Cause が変換されたものです。
Info(1:3,:) % describe(Transformer,1:3)ans=3×4 table
Type IsOriginal InputVariables Transformations
___________ __________ ______________ ______________________________________________________________
c(Region) Categorical true Region "Variable of type categorical converted from a cell data type"
Customers Numeric true Customers ""
c(Cause) Categorical true Cause "Variable of type categorical converted from a cell data type"
変数 OutageTime と RestorationTime は datetime 変数であり、バギング アンサンブル モデルの学習には使用できないため、生成された特徴量には含まれていません。ただし、生成された特徴量の中には、10 番目の特徴量 RestorationTime-OutageTime のように、それらの変数から派生した特徴量が一部含まれています。
Info(10,:) % describe(Transformer,10)ans=1×4 table
Type IsOriginal InputVariables Transformations
_______ __________ ___________________________ ________________________________________________________________
RestorationTime-OutageTime Numeric false OutageTime, RestorationTime "Elapsed time in seconds between OutageTime and RestorationTime"
一部の生成された特徴量については複数の変換が組み合わされています。たとえば、19 番目の特徴量 fenc(c(Cause)) は、変数 Cause を 10 のカテゴリでカテゴリカル変数に変換してから、そのカテゴリの頻度を計算して生成されたものです。
Info(19,:) % describe(Transformer,19)ans=1×4 table
Type IsOriginal InputVariables Transformations
_______ __________ ______________ ____________________________________________________________________________________________________________
fenc(c(Cause)) Numeric false Cause "Variable of type categorical converted from a cell data type -> Frequency encoding (number of levels = 10)"
gencfeatures で返される生成された特徴量から数値のものだけを使用して線形分類器に学習させます。
patients データ セットを読み込みます。変数のサブセットから table を作成します。
load patients
Tbl = table(Age,Diastolic,Height,SelfAssessedHealthStatus, ...
    Smoker,Systolic,Weight,Gender);
データを学習セットとテスト セットに分割します。観測値の約 70% を学習データとして使用し、観測値の約 30% をテスト データとして使用します。データの分割には cvpartition を使用します。
rng("default")
c = cvpartition(Tbl.Gender,Holdout=0.30);
TrainTbl = Tbl(training(c),:);
TestTbl = Tbl(test(c),:);
学習データを使用して新しい特徴量を 25 個生成します。新しい特徴量を選択する特徴選択方式には Minimum Redundancy Maximum Relevance (MRMR) を指定します。
Transformer = gencfeatures(TrainTbl,"Gender",25, ...
    FeatureSelectionMethod="mrmr")
Transformer =
  FeatureTransformer with properties:

                     Type: 'classification'
            TargetLearner: 'linear'
    NumEngineeredFeatures: 23
      NumOriginalFeatures: 2
         TotalNumFeatures: 25
生成された特徴量を調べます。
Info = describe(Transformer)
Info=25×4 table
                                      Type        IsOriginal         InputVariables                                              Transformations
                                   ___________    __________    ________________________    __________________________________________________________________________________________

    zsc(Weight)                    Numeric          true        Weight                      "Standardization with z-score (mean = 153.1571, std = 26.8229)"
    eb5(Weight)                    Categorical      false       Weight                      "Equal-width binning (number of bins = 5)"
    c(SelfAssessedHealthStatus)    Categorical      true        SelfAssessedHealthStatus    "Variable of type categorical converted from a cell data type"
    zsc(sqrt(Systolic))            Numeric          false       Systolic                    "sqrt( ) -> Standardization with z-score (mean = 11.086, std = 0.29694)"
    zsc(sin(Systolic))             Numeric          false       Systolic                    "sin( ) -> Standardization with z-score (mean = -0.1303, std = 0.72575)"
    zsc(Systolic./Weight)          Numeric          false       Systolic, Weight            "Systolic ./ Weight -> Standardization with z-score (mean = 0.82662, std = 0.14555)"
    zsc(Age+Weight)                Numeric          false       Age, Weight                 "Age + Weight -> Standardization with z-score (mean = 191.1143, std = 28.6976)"
    zsc(Age./Weight)               Numeric          false       Age, Weight                 "Age ./ Weight -> Standardization with z-score (mean = 0.25424, std = 0.062486)"
    zsc(Diastolic.*Weight)         Numeric          false       Diastolic, Weight           "Diastolic .* Weight -> Standardization with z-score (mean = 12864.6857, std = 2731.1613)"
    q6(Height)                     Categorical      false       Height                      "Equiprobable binning (number of bins = 6)"
    zsc(Systolic+Weight)           Numeric          false       Systolic, Weight            "Systolic + Weight -> Standardization with z-score (mean = 276.1429, std = 28.7111)"
    zsc(Diastolic-Weight)          Numeric          false       Diastolic, Weight           "Diastolic - Weight -> Standardization with z-score (mean = -69.4286, std = 26.2411)"
    zsc(Age-Weight)                Numeric          false       Age, Weight                 "Age - Weight -> Standardization with z-score (mean = -115.2, std = 27.0113)"
    zsc(Height./Weight)            Numeric          false       Height, Weight              "Height ./ Weight -> Standardization with z-score (mean = 0.44797, std = 0.067992)"
    zsc(Height.*Weight)            Numeric          false       Height, Weight              "Height .* Weight -> Standardization with z-score (mean = 10291.0714, std = 2111.9071)"
    zsc(Diastolic+Weight)          Numeric          false       Diastolic, Weight           "Diastolic + Weight -> Standardization with z-score (mean = 236.8857, std = 29.2439)"
      ⋮
学習セットとテスト セットを数値予測子のみを保持して変換します。
numericIdx = (Info.Type == "Numeric");
NewTrainTbl = transform(Transformer,TrainTbl,numericIdx);
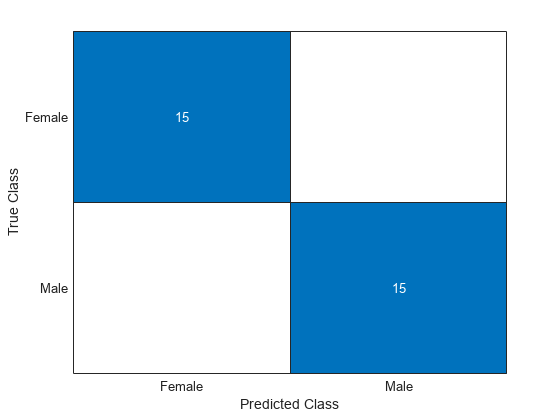
NewTestTbl = transform(Transformer,TestTbl,numericIdx);変換した学習データを使用して線形モデルに学習させます。混同行列を使用して、モデルのテスト セットの予測の精度を可視化します。
Mdl = fitclinear(NewTrainTbl,TrainTbl.Gender);
testLabels = predict(Mdl,NewTestTbl);
confusionchart(TestTbl.Gender,testLabels)
バージョン履歴
R2021a で導入