transform
生成された特徴量を使用した新しいデータの変換
説明
NewTbl = transform(Transformer,Tbl)FeatureTransformer オブジェクト Transformer で生成される変換された特徴量を含む table を返します。入力 Tbl に必要な変数が含まれていなければなりません。それらのデータ型は、Transformer を作成した際に gencfeatures または genrfeatures に最初に渡した変数と同じでなければなりません。
NewTbl = transform(Transformer,Tbl,Index)Index で、どの特徴量を返すかを指定します。
例
特徴量を生成して線形回帰モデルに学習させます。関数 crossval を使用して、モデルの交差検証平均二乗誤差 (MSE) を計算します。
patients データ セットを読み込み、予測子データが含まれている table を作成します。
load patients
Tbl = table(Age,Diastolic,Gender,Height,SelfAssessedHealthStatus, ...
    Smoker,Weight);
5 分割交差検証用に無作為分割を作成します。
rng("default") % For reproducibility of the partition
cvp = cvpartition(size(Tbl,1),KFold=5);
Tbl 内の元の特徴量および Systolic 応答変数で学習させた線形回帰モデルについて、交差検証 MSE を計算します。
CVMdl = fitrlinear(Tbl,Systolic,CVPartition=cvp);
cvloss = kfoldLoss(CVMdl)
cvloss =
45.2990
カスタム関数 myloss (この例の終わりに掲載) を作成します。この関数は、学習データから 20 個の特徴量を生成し、学習セットと同じ変換をテスト データに適用します。その後、線形回帰モデルを学習データに当てはめ、テスト セット MSE を計算します。
メモ: この例のライブ スクリプト ファイルを使用している場合、関数 myloss は既にファイルの終わりに含まれています。それ以外の場合は、この関数を .m ファイルの終わりに作成するか、MATLAB® パス上のファイルとして追加する必要があります。
Tbl 内の予測子から生成された特徴量で学習させた線形モデルについて、交差検証 MSE を計算します。
newcvloss = mean(crossval(@myloss,Tbl,Systolic,Partition=cvp))
newcvloss =
27.2205
function testloss = myloss(TrainTbl,trainY,TestTbl,testY)
[Transformer,NewTrainTbl] = genrfeatures(TrainTbl,trainY,20);
NewTestTbl = transform(Transformer,TestTbl);
Mdl = fitrlinear(NewTrainTbl,trainY);
testloss = loss(Mdl,NewTestTbl,testY);
end
gencfeatures で返される生成された特徴量から数値のものだけを使用して線形分類器に学習させます。
patients データ セットを読み込みます。変数のサブセットから table を作成します。
load patients
Tbl = table(Age,Diastolic,Height,SelfAssessedHealthStatus, ...
    Smoker,Systolic,Weight,Gender);
データを学習セットとテスト セットに分割します。観測値の約 70% を学習データとして使用し、観測値の約 30% をテスト データとして使用します。データの分割には cvpartition を使用します。
rng("default")
c = cvpartition(Tbl.Gender,Holdout=0.30);
TrainTbl = Tbl(training(c),:);
TestTbl = Tbl(test(c),:);
学習データを使用して新しい特徴量を 25 個生成します。新しい特徴量を選択する特徴選択方式には Minimum Redundancy Maximum Relevance (MRMR) を指定します。
Transformer = gencfeatures(TrainTbl,"Gender",25, ...
    FeatureSelectionMethod="mrmr")
Transformer =
  FeatureTransformer with properties:

                     Type: 'classification'
            TargetLearner: 'linear'
    NumEngineeredFeatures: 23
      NumOriginalFeatures: 2
         TotalNumFeatures: 25
生成された特徴量を調べます。
Info = describe(Transformer)
Info=25×4 table
                                      Type        IsOriginal         InputVariables                                              Transformations
                                   ___________    __________    ________________________    __________________________________________________________________________________________

    zsc(Weight)                    Numeric          true        Weight                      "Standardization with z-score (mean = 153.1571, std = 26.8229)"
    eb5(Weight)                    Categorical      false       Weight                      "Equal-width binning (number of bins = 5)"
    c(SelfAssessedHealthStatus)    Categorical      true        SelfAssessedHealthStatus    "Variable of type categorical converted from a cell data type"
    zsc(sqrt(Systolic))            Numeric          false       Systolic                    "sqrt( ) -> Standardization with z-score (mean = 11.086, std = 0.29694)"
    zsc(sin(Systolic))             Numeric          false       Systolic                    "sin( ) -> Standardization with z-score (mean = -0.1303, std = 0.72575)"
    zsc(Systolic./Weight)          Numeric          false       Systolic, Weight            "Systolic ./ Weight -> Standardization with z-score (mean = 0.82662, std = 0.14555)"
    zsc(Age+Weight)                Numeric          false       Age, Weight                 "Age + Weight -> Standardization with z-score (mean = 191.1143, std = 28.6976)"
    zsc(Age./Weight)               Numeric          false       Age, Weight                 "Age ./ Weight -> Standardization with z-score (mean = 0.25424, std = 0.062486)"
    zsc(Diastolic.*Weight)         Numeric          false       Diastolic, Weight           "Diastolic .* Weight -> Standardization with z-score (mean = 12864.6857, std = 2731.1613)"
    q6(Height)                     Categorical      false       Height                      "Equiprobable binning (number of bins = 6)"
    zsc(Systolic+Weight)           Numeric          false       Systolic, Weight            "Systolic + Weight -> Standardization with z-score (mean = 276.1429, std = 28.7111)"
    zsc(Diastolic-Weight)          Numeric          false       Diastolic, Weight           "Diastolic - Weight -> Standardization with z-score (mean = -69.4286, std = 26.2411)"
    zsc(Age-Weight)                Numeric          false       Age, Weight                 "Age - Weight -> Standardization with z-score (mean = -115.2, std = 27.0113)"
    zsc(Height./Weight)            Numeric          false       Height, Weight              "Height ./ Weight -> Standardization with z-score (mean = 0.44797, std = 0.067992)"
    zsc(Height.*Weight)            Numeric          false       Height, Weight              "Height .* Weight -> Standardization with z-score (mean = 10291.0714, std = 2111.9071)"
    zsc(Diastolic+Weight)          Numeric          false       Diastolic, Weight           "Diastolic + Weight -> Standardization with z-score (mean = 236.8857, std = 29.2439)"
      ⋮
学習セットとテスト セットを数値予測子のみを保持して変換します。
numericIdx = (Info.Type == "Numeric");
NewTrainTbl = transform(Transformer,TrainTbl,numericIdx);
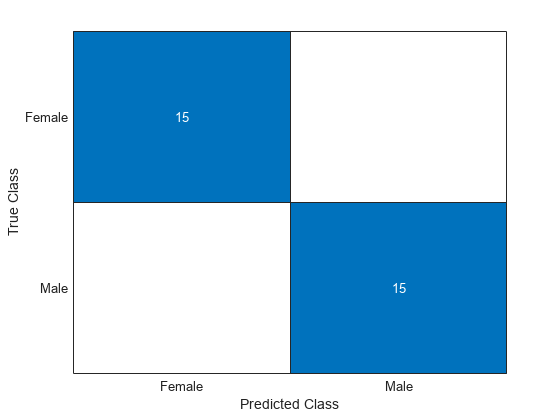
NewTestTbl = transform(Transformer,TestTbl,numericIdx);変換した学習データを使用して線形モデルに学習させます。混同行列を使用して、モデルのテスト セットの予測の精度を可視化します。
Mdl = fitclinear(NewTrainTbl,TrainTbl.Gender);
testLabels = predict(Mdl,NewTestTbl);
confusionchart(TestTbl.Gender,testLabels)
入力引数
出力引数
バージョン履歴
R2021a で導入