plotComparisons
構文
説明
plotComparisons( は、前の構文におけるいずれかの入力引数の組み合わせを使用して座標軸 ax,___)ax にプロットします。
plotComparisons(___, では、1 つ以上の名前と値の引数を使用して追加オプションを指定します。たとえば、比較区間の範囲の信頼水準を指定できます。 Name=Value)
f = plotComparisons(___)Figure オブジェクト f を返します。f は、Figure の作成後にそのプロパティをクエリまたは変更するのに使用します。
例
ポップコーン生産量のデータを読み込みます。
load popcorn.mat6 行 3 列の行列 popcorn の列に、Gourmet、National、および Generic の各ブランドについてのポップコーン生産量 (カップ数) の観測値がそれぞれ格納されています。
1 因子 ANOVA を実行して、3 つのブランドのいずれでも平均生産量が同じであるという帰無仮説を検定します。関数repmatを使用して、ブランドの因子の値を格納する string ベクトルを作成します。
factors = [repmat("Gourmet",6,1); repmat("National",6,1); repmat("Generic",6,1)];
aov = anova(factors,popcorn(:),"FactorNames","Brand")
aov =
1-way anova, constrained (Type III) sums of squares.

Y ~ 1 + Brand

             SumOfSquares    DF    MeanSquares     F        pValue
             ____________    __    ___________    ____    __________

    Brand       15.75         2        7.875      18.9    7.9603e-05
    Error        6.25        15      0.41667
    Total          22        17


  Properties, Methods
aov は 1 因子 ANOVA の結果を格納する anova オブジェクトです。
Brand の "p" 値が小さく、帰無仮説を 99% の信頼水準で棄却できることを示しています。少なくとも 1 つのブランドの平均ポップコーン生産量に統計的な有意差があると結論付けるだけの十分な証拠があります。この差について、比較区間を使用してグループ平均をプロットすることで確認できます。
plotComparisons(aov);
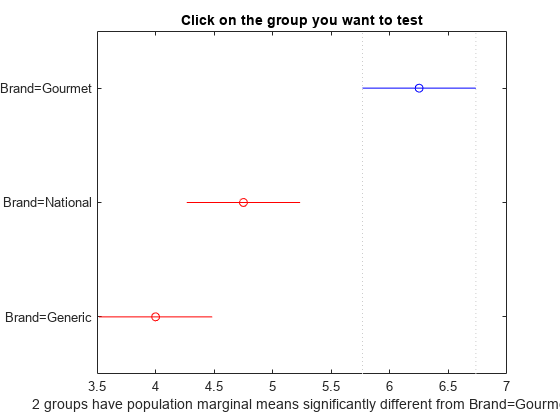
Figure では、Gourmet の比較区間が青、National と Generic の比較区間が赤で示されています。この色は、Gourmet が Generic および National と統計的に異なることを示しています。
Generic の平均をクリックします。プロットの表示が変わり、Generic の比較区間が青、National の比較区間がグレー、Gourmet の比較区間が赤で示されます。この色は、Generic と National の平均ポップコーン生産量に統計的な有意差がないことを示しています。

入力引数
名前と値の引数
出力引数
参照
[1] Hochberg, Y., and A. C. Tamhane. Multiple Comparison Procedures. Hoboken, NJ: John Wiley & Sons, 1987.
[2] Milliken, G. A., and D. E. Johnson. Analysis of Messy Data, Volume I: Designed Experiments. Boca Raton, FL: Chapman & Hall/CRC Press, 1992.
[3] Searle, S. R., F. M. Speed, and G. A. Milliken. “Population marginal means in the linear model: an alternative to least-squares means.” American Statistician. 1980, pp. 216–221.
バージョン履歴
R2022b で導入
参考
multcompare | groupmeans | anova | 1 因子 ANOVA | 2 因子 ANOVA | 多因子 ANOVA