メインコンテンツ

このページの内容は最新ではありません。最新版の英語を参照するには、ここをクリックします。

convertToSTT

Stateflow チャートを状態遷移表に変換

R2023b 以降

説明

table = convertToSTT(chart) は、ロック解除されている Stateflow® チャート chart を状態遷移表に変換します。

すべて折りたたむ

この例では、Stateflow® チャートを状態遷移表に変換する方法を示します。

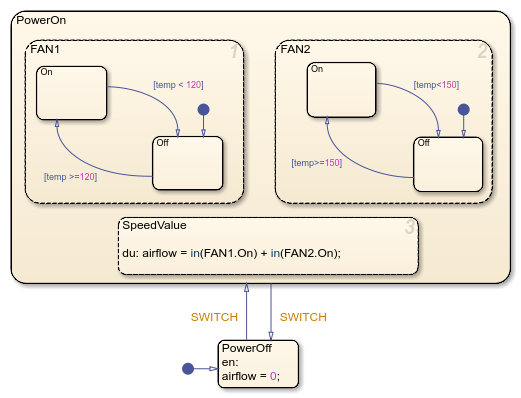
モデル例を開き、Stateflow.Chart オブジェクトにアクセスします。

open_system("sf_aircontrol")
chart = find(sfroot,"-isa","Stateflow.Chart");
view(chart)

Stateflow chart that contains top level states, PowerOn and PowerOff. PowerOn has parallel substates FAN1, FAN2, and SpeedValue. Each of FAN1 and FAN2 have exclusive substates On and Off.

チャートを状態遷移表に変換します。

table = convertToSTT(chart);
view(table)
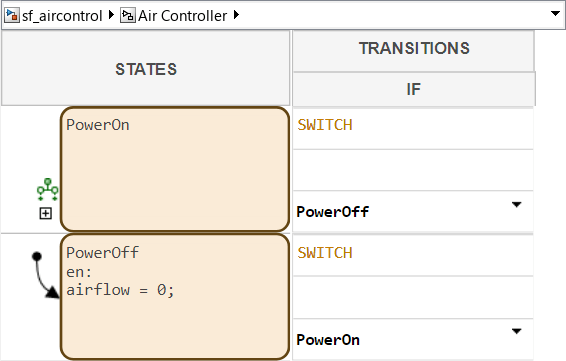
State transition table that represents the same logic as the original chart. The table displays the top level states, PowerOn and PowerOff. The hierarchy under state PowerOn is hidden by default.

ステート Power_On の子ステートを表示するには、ステートの左にある ボタンをクリックします。

State transition table that represents the same logic as the original chart. The table displays the top level states, PowerOn and PowerOff. The hierarchy under state PowerOn is expanded, and shows parallel substates FAN1, FAN2, and SpeedValue.

入力引数

すべて折りたたむ

変換する Stateflow チャート。Stateflow.Chart オブジェクトとして指定します。

制限

  • スーパートランジションを含むチャートはサポートされていません。

  • チャートは Simulink® モデルの最上位になければなりません。

  • チャートにバリアント遷移が含まれていてはなりません。

バージョン履歴

R2023b で導入