Debug MATLAB Function Blocks
You can use the MATLAB Function Block Editor to debug MATLAB Function block code. The MATLAB Function Block Editor includes some of the same debugging tools available in the MATLAB® editor. To debug MATLAB Function block code, set at least one breakpoint and run the simulation.
Debug an Example Function
This example uses the model call_stats_block2, which you create in
Implement MATLAB Functions in Simulink with MATLAB Function Blocks. To debug the
MATLAB Function block code in this model:
Open the example that contains the
call_stats_block2model, close the other model, and opencall_stats_block2.openExample("simulink/BasicMLFBSetupExample") close_system("call_stats_block1") open_system("call_stats_block2")
Double-click the MATLAB Function block to open the MATLAB Function Block Editor.
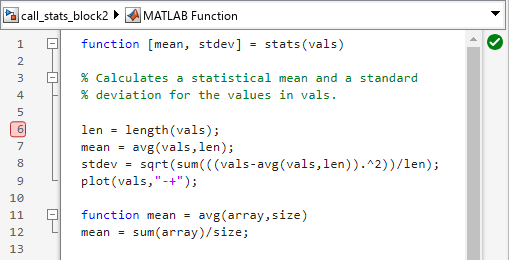
In the MATLAB Function Block Editor, click the line number to the left of the line:
len = length(vals);
The line number is highlighted in red, which indicates the breakpoint.
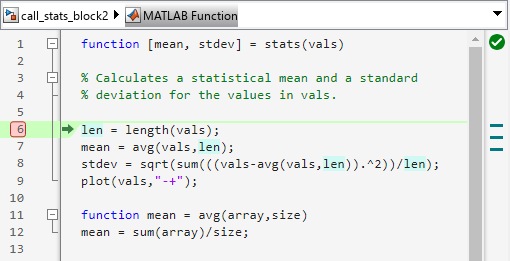
Simulate the model.
The simulation pauses when execution reaches the breakpoint. A green arrow points to where the simulation has paused.
On the Function tab, click Step Over to advance execution.
The execution advances to the next line, which calls the local function
avg.On the Function tab, click Step In.
Execution advances to the local function
avg. Once you are in a local function, you can use the Step Over or Step In commands to advance execution. If the local function calls another local function, use Step In to enter it. If you want to execute the remaining lines of the local function, use Step Out.Click Step Over to execute the only line in
avg.Click Step Over to return to the
statsfunction.Execution advances to the line after the call to
avg.Click Step Over twice to calculate the
stdevand to execute theplotfunction.The
plotfunction executes in MATLAB: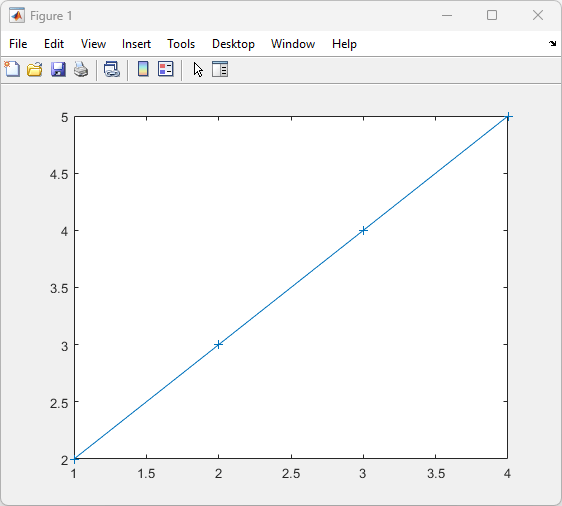
Click Continue to continue executing the model.
If you return to the model, the computed values of
meanandstdevappear in the Display blocks.In the MATLAB Function Block Editor, click Stop to stop the simulation.
Note
You can debug MATLAB Function blocks in Normal and Accelerator modes. However, if you simulate a model in Accelerator mode that uses a MATLAB Function block in a model reference, the parent model simulation ignores the breakpoints.
Set Conditions on Breakpoints
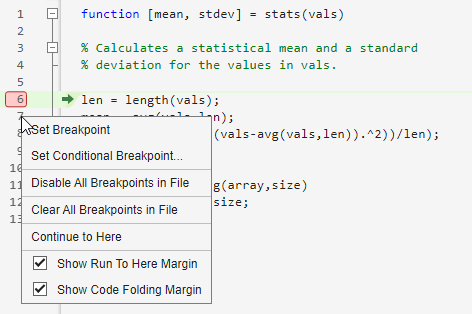
You can enter a MATLAB expression as a condition on a breakpoint inside a MATLAB Function block. Simulation then pauses on that breakpoint only when the condition is true. To set a conditional breakpoint, in the MATLAB Function Block Editor, right-click the line number to the left of a line of code and select Set Conditional Breakpoint, and enter the condition in the dialog box. You can use any valid MATLAB expression as a condition. This expression can include numerical values and any data that is in scope at the breakpoint.
To add or modify a condition on an existing breakpoint, right-click the breakpoint and select Set/Modify Condition.
Watch Function Variables During Simulation
You can use several tools to track the variable values of the function while you simulate a MATLAB Function block.
Note
The MATLAB Function block does not report the values of handle objects.
Handle objects include any handle class subclasses and system
objects.
Watch Function Variables in the Code
To view the value of a variable in the function of a MATLAB Function block during simulation in the code:
Add a breakpoint to the MATLAB Function Block Editor.
Run the model.
When the simulation pauses, point to a variable name. A tooltip displays the current variable value.
For example, to watch the variable
stdevduring simulation, point tolenin the code.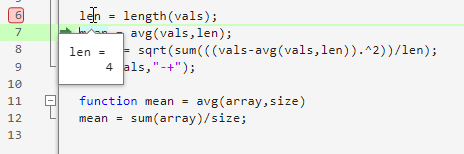
Watch Function Variables in the Symbols Pane
Since R2022a
To view the value of a variable in the Symbols pane in a MATLAB Function block during simulation:
Open the Symbols pane. In the MATLAB Function Block Editor, in the Function tab, click Edit Data.
Add a breakpoint to the MATLAB Function Block Editor.
Run the model.
When the simulation pauses, the Symbols pane updates with the values at the breakpoint. If the variable is an array, the Value column displays the dimension and data type of the variable. Point to the Value column to see the values.
For example, to view the variable
valsduring simulation, point to the value ofvalsin the Value column.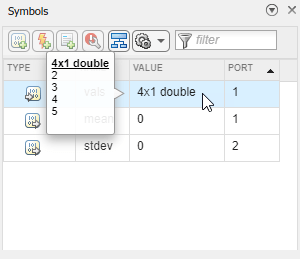
Watching Function Variables with the Command Line Debugger
You can view the values for a function variable in the Command Window during
simulation. When you reach a breakpoint, enter the name of a variable at the
debug>> prompt to see its value.
debug>> stdev

	1.1180

debug>>
You can also enter these commands in the command window while debugging:
| Command | Description |
|---|---|
| Continue execution to next breakpoint. |
| Quit debugging and terminate the simulation. |
| Advance to next program step after a breakpoint is encountered. Step over or step into/out of a MATLAB local function. |
| Display help for command line debugging. |
| Display the value of the variable |
| Saves all variables in the current scope to the specified file. Follows
the syntax of the MATLAB
|
| Equivalent to |
| Display the variables in the current scope. |
| Display the size and class (type) of all variables in the current scope. |
If you enter other commands at the debug>> prompt, the results
execute in the workspace of the MATLAB Function block. To issue a command
in the MATLAB base workspace, use the evalin command with the first argument "base" followed by
the second argument command, for example, evalin("base","whos"). You
cannot define or change variables at the debug>> prompt.
Display Size Limits
The MATLAB Function Block Editor does not display the contents of
matrices that have more than two dimensions or more than 200 elements.
For matrices that exceed these limits, the MATLAB Function Block Editor
displays the shape and base type only.
Check for Data Range Violations
MATLAB Function blocks check inputs and outputs for data range violations
when the input or output values enter or leave the blocks. To enable data range violation
checking, open the Configuration Parameters window, click Diagnostics > Data Validity, and set Simulation range checking to
error or warning.
Specify a Data Range
To specify a range for input and output variables, in the MATLAB Function Block Editor, use the Symbols pane and the Property Inspector (since R2022a):
In the Symbols pane, click the variable of interest.
In the Property Inspector, in the Properties tab, adjust the Limit range property by entering the desired values for Minimum and Maximum.
Debug MATLAB Function Blocks in Initialize Function and Terminate Function Blocks
When you use MATLAB Function blocks in Initialize Function or Terminate Function blocks, you cannot use the buttons in the Debug Code section to navigate through breakpoints. You must use the command line debugger or the line number context menu options.
To use the line number context menu, in the MATLAB Function Block Editor, add a breakpoint and run the simulation. During simulation, right-click any of the line numbers after the breakpoint and click Continue to Here.