データのピークの検出
関数 findpeaks を使用して、データのセットから局所的最大値とその位置を検出します。
ファイル spots_num には、1749 年から 2012 年までに毎年観測された太陽黒点数の平均が含まれています。局所的最大値とその発生年を検出します。これらとデータをプロットします。
load("spots_num")

[pks,locs] = findpeaks(avSpots);

plot(year,avSpots,year(locs),pks,"o")
xlabel("Year")
ylabel("Sunspot Number")
axis tight
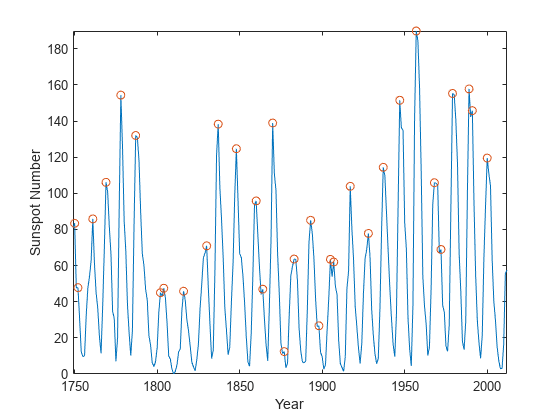
距離が非常に近いピークがいくつかあります。定期的には繰り返されない種類のものです。50 年間でこのようなピークは約 5 回あります。
サイクルの期間をより正確に推定するには、もう一度 findpeaks を使用します。ただし、今回はピークツーピークの間隔を 6 年以上に制限します。局所的最大値間の平均間隔を計算します。
[pks,locs] = findpeaks(avSpots,MinPeakDistance=6);

plot(year,avSpots,year(locs),pks,"o")
xlabel("Year")
ylabel("Sunspot Number")
axis tight
legend(["Data" "peaks"],Location="NorthWest")
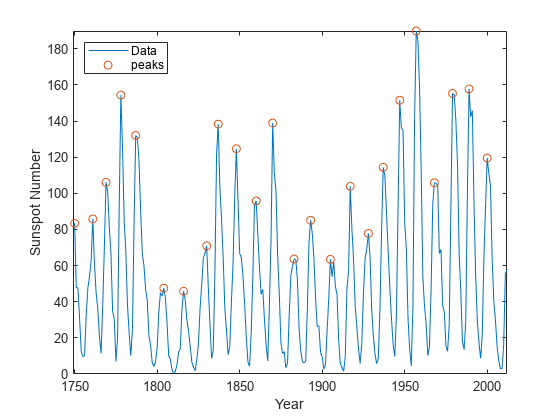
meanCycle = mean(diff(locs))
meanCycle =
10.8696
太陽の活動は約 11 年ごとに繰り返されているということが知られています。フーリエ変換を使って確認します。信号の変動に集中できるよう、平均値を減算します。サンプル レートが年単位で測定されていることを思い出してください。ナイキスト周波数以下の周波数を使用します。
fs = 1;
Nf = 512;

df = fs/Nf;
f = 0:df:fs/2-df;

trSpots = fftshift(fft(avSpots-mean(avSpots),Nf));
dBspots = mag2db(abs(trSpots(Nf/2+1:Nf)));

plot(f,dBspots)
xline(1/meanCycle,Color="#77AC30")
xlabel("Frequency (year^{-1})")
ylabel("| FFT | (dB)")
ylim([20 85])
text(1/meanCycle + 0.02,25,"<== 1/"+num2str(meanCycle))
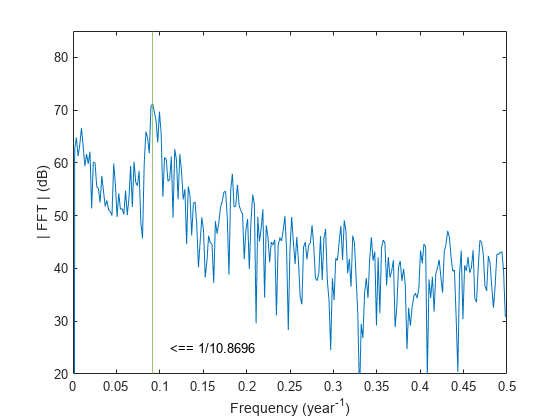
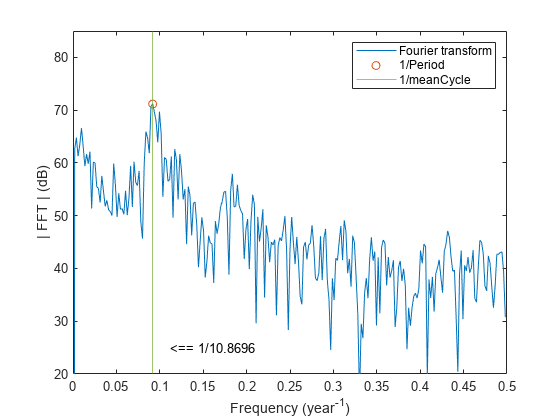
フーリエ変換は予期された周波数でまさにピークを迎え、11 年ごとの推定が確認されます。フーリエ変換の最も高いピークを特定して周期を求めることもできます。この 2 つの推定はぴったり一致します。
[pk,MaxFreq] = findpeaks(dBspots,NPeaks=1,SortStr="descend");

Period = 1/f(MaxFreq)
Period = 10.8936
hold on
plot(f(MaxFreq),pk,"o")
hold off
legend(["Fourier transform" "1/meanCycle" "1/Period"])