プログラムによるプレゼンテーション コンテンツの更新
PPT API を使用すると、既存の PowerPoint® プレゼンテーションのコンテンツをプログラムによって更新できます。
既存のプレゼンテーションの生成
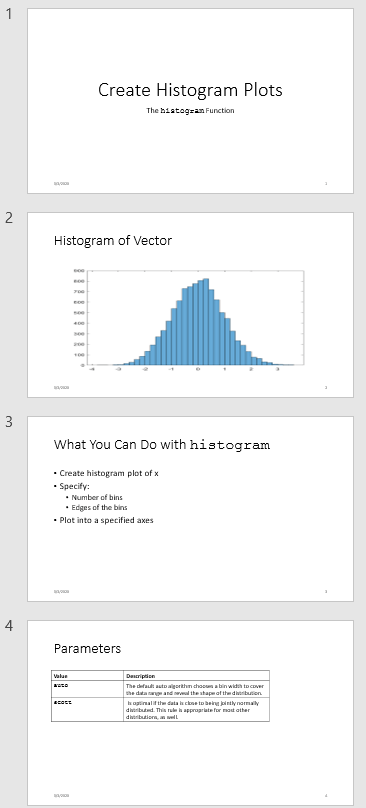
この例では、PowerPoint プレゼンテーション myPresentation のコンテンツを更新します。プレゼンテーションを生成するには、プログラムによるプレゼンテーションの作成の例を実行します。プレゼンテーションをプログラムにより作成しますが、生成されたプレゼンテーションは他の PowerPoint プレゼンテーションと変わりません。このプレゼンテーションには次の 4 つのスライドが含まれます。
タイトルが
Create Histogram Plotsのタイトル スライドベクトルのヒストグラム
タイトルが
What You Can Do with histogramのスライドヒストグラム関数のパラメーター
PPT API を使用して既存の PowerPoint プレゼンテーションのコンテンツをプログラムによって更新するには、以下のようにします。
置き換えるコンテンツ オブジェクトに名前を付けて、PowerPoint プレゼンテーションを設定します。新しいコンテンツを追加する場合は、そのコンテンツのプレースホルダーをプレゼンテーションに挿入します。
MATLAB® で、
mlreportgen.pptPPT API 名前空間をインポートします。既存のプレゼンテーションを更新バージョンのテンプレートとして使用する
Presentationオブジェクトを作成します。更新する既存のスライド コンテンツを置き換えます。
新しいスライドを追加します。
プレゼンテーションを生成します。
プレゼンテーションの更新
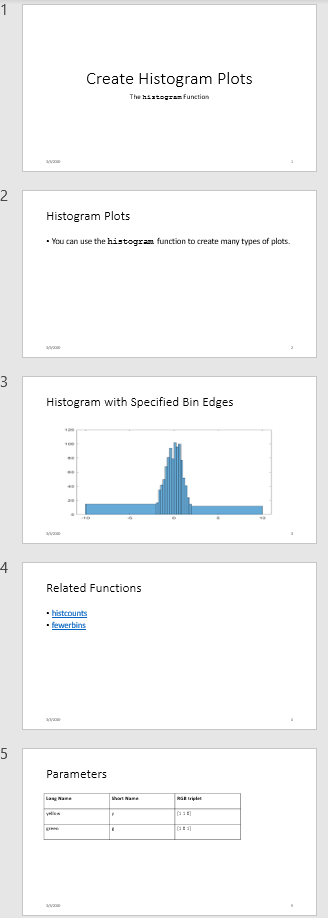
この例では、PPT API を使用して、myPresentation プレゼンテーションに以下の変更を加えます。
2 番目のスライドの画像を置き換える。
3 番目のスライドのテキストを置き換える。
4 番目のスライドのテーブルを置き換える。
図のあるスライドの前に新しいスライドを挿入する。
更新されたプレゼンテーションは次のようになります。
既存のプレゼンテーションの設定
PPT API プログラムは、プレゼンテーションの生成に PowerPoint テンプレートを使用します。既存の PowerPoint プレゼンテーションをプログラムによって更新する場合、そのプレゼンテーションを更新後のプレゼンテーションのテンプレートとして使用します。Slide オブジェクトのコンテンツを更新するために、PPT API を使用します。
myPresentationプレゼンテーションを開きます。PowerPoint で、[ビュー] 、 [標準] をクリックします。スライドのコンテンツ オブジェクトの名前を表示します。[ホーム] タブで、[選択] 、 [オブジェクトの選択と表示] をクリックします。スライドのコンテンツをクリックすると、[選択] ペインでそのコンテンツ オブジェクトの名前が強調表示されます。
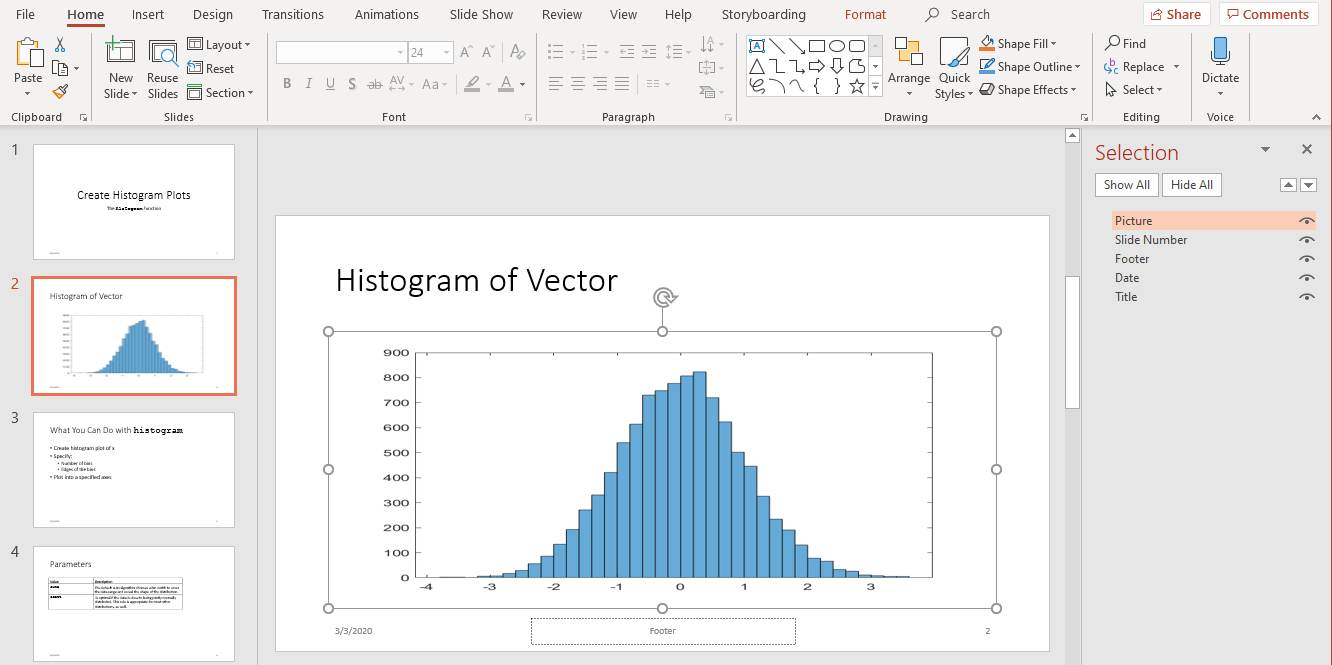
コンテンツ オブジェクトの名前を変更します。PowerPoint の [選択] ペインで、コンテンツ名のボックスをクリックし、現在の名前を目的の名前に置き換えます。コンテンツ オブジェクトの更新にはこれらの一意の名前を使用します。
2 番目のスライドでは、
Titleオブジェクト名をHistogramに変更し、Pictureオブジェクト名をHistBinsに変更します。3 番目のスライドでは、
TitleをRelatedFuncsに変更します。ContentはFuncListに変更します。4 番目のスライドでは、
TableをParamTableに変更します。
PPT API 名前空間のインポート
すべての PPT API クラス名には、接頭辞 mlreportgen.ppt が含まれます。コードに接頭辞を含める必要性をなくすには、PPT API プログラムの先頭にこのステートメントを挿入します。
import mlreportgen.ppt.*メモ
この例のプログラムでは import 行は最初の行です。この例では、PPT API プログラムをセクションごとに作成するため import コマンドを示しません。完全なプログラムを確認するには、myUpdatedPresentation プログラムをクリックしてください。
Presentation オブジェクトの作成
Presentation オブジェクトを作成します。以下を指定します。
生成されるプレゼンテーションの出力ファイルとしての
myUpdatedPresentation.pptx。PowerPoint テンプレートとしての
myPresentation.pptx。更新対象のプレゼンテーション ファイルをテンプレート ファイルとして使用します。
ppt = Presentation("myUpdatedPresentation.pptx","myPresentation.pptx");
open(ppt);
出力ファイルに別の名前を指定すると、元のプレゼンテーションが保持されます。既存のプレゼンテーションを上書きする場合は、テンプレート ファイル名を出力ファイルのファイル名として使用できます。
画像の置換
2 番目のスライドのタイトルを変更します。Picture オブジェクトを作成し、既存の画像と置き換えます。find メソッドを Presentation オブジェクトで使用することで、HistBins および Histogram という名前 (PowerPoint を使用して指定した一意の名前) のコンテンツ オブジェクトを見付けることができます。
histTitle = Paragraph("Histogram with Specified Bin Edges");
replace(ppt,"Histogram",histTitle);

x = randn(1000,1);
edges = [-10 -2:0.25:2 10];
h = histogram(x,edges);
saveas(gcf,"hist_plot.png");

plotEdges = Picture("hist_plot.png");

replace(ppt,"HistBins",plotEdges);
リンク付きテキストの置換
3 番目のスライドのタイトルを変更します。既存のテキストを置き換えるテキストを作成します。このテキストに、MathWorks® オンライン ドキュメンテーションへのリンクを含めます。ExternalLink オブジェクトを Paragraph オブジェクトに追加し、Paragraph オブジェクトの cell 配列を使用してスライド コンテンツを置き換えます。
funcsTitle = Paragraph("Related Functions");
replace(ppt,"RelatedFuncs",funcsTitle);

histCounts = Paragraph();
histCountsLink = ExternalLink...
("https://www.mathworks.com/help/matlab/ref/histcounts.html","histcounts");
append(histCounts,histCountsLink);

fewerbins = Paragraph();
fewerbinsLink = ExternalLink...
("https://www.mathworks.com/help/matlab/ref/matlab.graphics.chart.primitive.histogram.fewerbins.html","fewerbins");
append(fewerbins,fewerbinsLink);

replace(ppt,"FuncList",{histCounts,fewerbins});
テーブルの置換
テーブルを作成するには、Table オブジェクトを作成します。Table コンストラクターで、テーブル セルの値の cell 配列を指定できます。先頭の行のテキストを太字にするには、cell 配列の最初の 3 つの要素として Paragraph オブジェクトを含めます。その後、テーブルを置き換えます。
long = Paragraph("Long Name");
long.Bold = true;
short = Paragraph("Short Name");
short.Bold = true;
rgb = Paragraph("RGB triplet");
rgb.Bold = true;

table2 = Table({long,short,rgb;"yellow","y","[1 1 0]";"green","g","[1 0 1] "});

contents = find(ppt,"ParamTable");
replace(ppt,"ParamTable",table2);
新しいスライドの挿入
PPT API を使用して、既存のプレゼンテーションに新しいスライドを挿入し、そのスライドの数値による位置を指定できます。たとえば、次のコードは新しいスライドをプレゼンテーションの 5 番目のスライドに設定します。
newSlide = add(ppt,"Title and Content",5);ただし、後で他のスライドを追加または削除しても変わらないように、あるスライドを特定のスライドの前に置くには、参照スライドを指定します。既存の PowerPoint プレゼンテーションを更新するときにこの方法を使用するには、PPT API を使用して参照スライドに名前を付けます。新しいスライドを挿入する際にその参照スライドの名前を使用します。
ppt.Children(2).Name = "ReferenceSlide";

refSlide = find(ppt,"ReferenceSlide");
introSlide = add(ppt,"Title and Content",refSlide);

contents = find(introSlide,"Title");
replace(contents(1),"Histogram Plots");

introText = Paragraph("You can use the ");
code = Text("histogram");
code.Font = "Courier New";
append(introText,code);
append(introText,"  function to create many types of plots.");

contents = find(introSlide,"Content");
replace(contents(1),introText);
プレゼンテーションの生成と表示
PowerPoint プレゼンテーションを生成します。close メソッドを Presentation オブジェクトで使用します。プレゼンテーションを表示します。
close(ppt);
rptview(ppt);
myUpdatedPresentation のコード
myUpdatedPresentation プレゼンテーションを作成する完全な PPT API プログラムは次のとおりです。
メモ
このコードでは myPresentation.pptx ファイルが現在のフォルダーにある必要があります。プレゼンテーションを生成するには、プログラムによるプレゼンテーションの作成の例を実行します。myUpdatedPresentation のコードを実行する前に、既存のプレゼンテーションに既存のプレゼンテーションの設定で説明されている変更が含まれていることを確認してください。
import mlreportgen.ppt.*;

ppt = Presentation("myUpdatedPresentation.pptx","myPresentation.pptx");
open(ppt);

histTitle = Paragraph("Histogram with Specified Bin Edges");
replace(ppt,"Histogram",histTitle);

x = randn(1000,1);
edges = [-10 -2:0.25:2 10];
h = histogram(x,edges);
saveas(gcf,"hist_plot.png");

plotEdges = Picture("hist_plot.png");

replace(ppt,"HistBins",plotEdges)

funcsTitle = Paragraph("Related Functions");
replace(ppt,"RelatedFuncs",funcsTitle);

histCounts = Paragraph();
histCountsLink = ExternalLink...
("https://www.mathworks.com/help/matlab/ref/histcounts.html","histcounts");
append(histCounts,histCountsLink);

fewerbins = Paragraph();
fewerbinsLink = ExternalLink...
("https://www.mathworks.com/help/matlab/ref/matlab.graphics.chart.primitive.histogram.fewerbins.html","fewerbins");
append(fewerbins,fewerbinsLink);

replace(ppt,"FuncList",{histCounts,fewerbins});

long = Paragraph("Long Name");
long.Bold = true;
short = Paragraph("Short Name");
short.Bold = true;
rgb = Paragraph("RGB triplet");
rgb.Bold = true;

table2 = Table({long,short,rgb;"yellow","y","[1 1 0]"; "green", "g","[1 0 1] "});

contents = find(ppt,"ParamTable");
replace(ppt,"ParamTable",table2);


ppt.Children(2).Name = "ReferenceSlide";

refSlide = find(ppt,"ReferenceSlide");
introSlide = add(ppt,"Title and Content",refSlide(1));

contents = find(introSlide,"Title");
replace(contents(1),"Histogram Plots");

introText = Paragraph("You can use the ");
code = Text("histogram ");
code.Style = {FontFamily("Courier New")};
append(introText,code);
append(introText,"function to create many types of plots.");

contents = find(introSlide,"Content");
replace(contents(1),introText);

close(ppt);
rptview(ppt);