timeSeriesOcsvmAD
Create a machine learning one-class SVM anomaly detector model for time series data
Since R2026a
Description
Add-On Required: This feature requires the Time Series Anomaly Detection for MATLAB add-on.
timeSeriesOcsvmAD creates an anomaly detector based on the
machine learning One-Class SVM (support vector machine) algorithm. This
algorithm detects anomalies by separating data from the origin in the transformed
high-dimensional predictor space, and finding a decision boundary.
For more information on the model that timeSeriesOcsvmAD creates, see
<>.
creates a detector = timeSeriesOcsvmAD(numChannels)TimeseriesOCSVMDetector model for time series data with
numChannels input channels.
detector = timeSeriesOcsvmAD(
sets additional options using one or more name-value arguments.numChannels,Name=Value)
For example, detector = timeSeriesOcsvmAD(3,IterationLimit=500) sets
the iteration limit for optimization to 500.
Examples
Load the file sineWaveAnomalyData.mat, which contains two sets of synthetic 3-channel sinusoidal signals.
sineWaveNormal contains 10 sinusoids of stable frequency and amplitude. Each signal has a series of small-amplitude impact-like imperfections. The signals have different lengths and initial phases. sineWaveAbnormal contains 3 sinusoids that contain the same normal data as sineWaveNormal, but that also include anomalous data.
load sineWaveAnomalyData.mat sineWaveNormal sineWaveAbnormal
Plot input signals
Plot all 3 channels of the first three anomalous signals.
s1 = 3; tiledlayout("vertical") ax = zeros(s1,1); for kj = 1:s1 ax(kj) = nexttile; plot(sineWaveAbnormal{kj}) title("Anomalous Signals") end

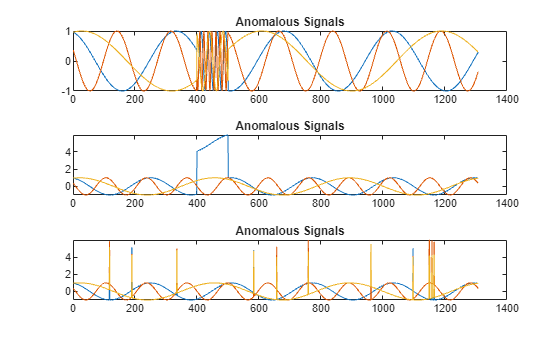
sineWaveAbnormal contains three signals, all of the same length. Each signal in the set has one or more anomalies.
All channels of the first signal have an abrupt change in frequency that lasts for a finite time.
The second signal has a finite-duration amplitude change in one of its channels.
The third signal has spikes at random times in all channels.
Create Detector
Use the TimeSeriesOCSVM detector to create a one-class SVM detector with 3 channels.Set an iteration limit of 500.
detector_tsocsvm = timeSeriesOcsvmAD(3,IterationLimit=500)
detector_tsocsvm =
TimeSeriesOCSVMDetector with properties:
BlockSize: 4000
KernelScale: "auto"
Lambda: "auto"
NumExpansionDimensions: "auto"
BetaTolerance: 1.0000e-04
GradientTolerance: 1.0000e-06
IterationLimit: 500
NumChannels: 3
IsTrained: 0
WindowLength: 10
TrainingStride: 1
DetectionStride: 10
Threshold: []
ThresholdMethod: "kSigma"
ThresholdParameter: 3
ThresholdFunction: []
Normalization: "zscore"
FeatureExtraction: 1
Train Detector
Train the detector using the normal data.
detector_tsocsvm = train(detector_tsocsvm,sineWaveNormal);
View the threshold that train computes and saves within detector_tslof. This computed value is influenced by random factors, such as which subsets of the data are used for training, and can change somewhat for different training sessions and different machines.
thresh = detector_tsocsvm.Threshold
thresh = -0.5513
Plot Anomaly Scores
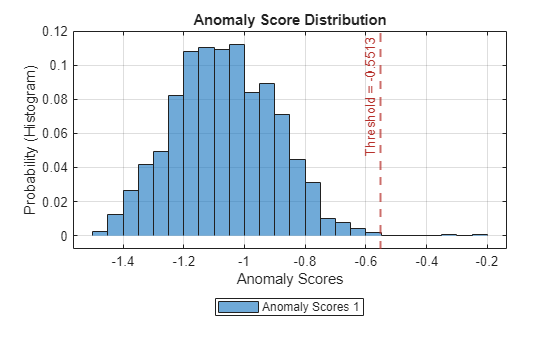
Plot the histogram of the anomaly scores for the normal data. Each score is calculated over a single detection window. The threshold, plotted as a vertical line, does not always completely bound the scores.
plotHistogram(detector_tsocsvm,sineWaveNormal);

Use Detector to Identify Anomalies
Use the detect function to determine the anomaly scores for the anomalous data. Then, plot the anomaly scores of the normal and anomalous data together.
results = detect(detector_tsocsvm, sineWaveAbnormal);
results is a cell array that contains three tables, one table for each signal. Each cell table contains three variables: WindowLabel, WindowAnomalyScore, and WindowStartIndices.
View the contents of the five rows between 10 and 15 of the third table.
results_table3 = results{3};
results_t3_rows10to15 = results_table3(10:15,:)results_t3_rows10to15=6×3 table
false -1.3501 91
false -0.9483 101
true 0.0534 111
false -0.9461 121
false -0.9045 131
false -1.1543 141
The results indicate an anomaly in the third window of this set. The anomaly score is significantly distant from the scores for the other windows.
Plot Anomaly Score Distributions
Plot a histogram that shows the anomaly scores for both sets of data together, along with the threshold, for comparison.
plotHistogram(detector_tsocsvm,sineWaveNormal,sineWaveAbnormal)

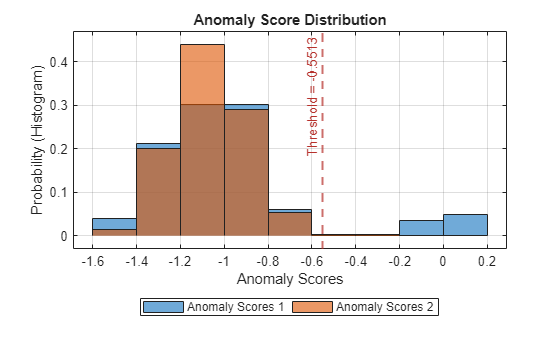
The histogram uses different colors for the normal (Data 1) and anomalous (Data 2) data. Both types of data appear to the left of the threshold. To the right of threshold, Data 2 is prevalent.
Plot Detected Anomalies
Plot the detected anomalies of the third abnormal signal set.
plot(detector_tsocsvm,sineWaveAbnormal{3})
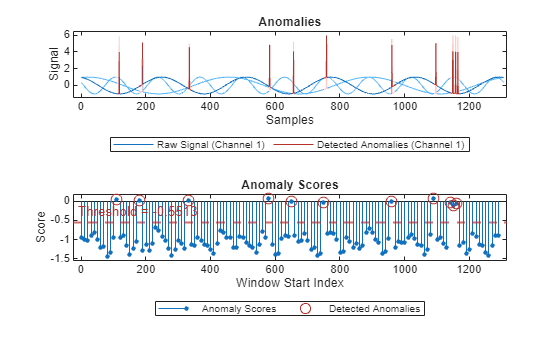
The top plot shows an overlay of red where the anomalies occur. The bottom plot shows how effective the threshold is at dividing the normal from the abnormal scores for Signal set 3.
Input Arguments
Number of input channels in each time series, specified as a positive integer. All time series inputs must have the same number of channels.
Name-Value Arguments
Specify optional pairs of arguments as
Name1=Value1,...,NameN=ValueN, where Name is
the argument name and Value is the corresponding value.
Name-value arguments must appear after other arguments, but the order of the
pairs does not matter.
Example: detector = timeSeriesOcsvmAD(3,DetectionWindowLength=20) sets
the length of the detection window to 20.
Window
Window length of each time series segment, specified as a positive integer.
Stride length of sliding window in training stage, specified as a positive integer.
Stride length of sliding window in detection stage, specified as a positive
integer. DetectionStride controls the number of overlapped
samples. Increasing the amount of overlap provides higher resolution, but at higher
computational cost.
If you do not specify DetectionStride, the software sets the
stride length to the value of WindowLength to create
non-overlapping windows.
Feature Extraction
Enable feature extraction option, specified as 1(true) or
0(false).
When
FeatureExtractionis enabled, the software extracts statistical features to use during training. Extracted features are generally cleaner and more meaningful than raw data, but the extraction process can be computationally expensive.When
FeatureExtractionis disabled, the training process uses only raw data. Raw data is likely to be noisier and include random disturbances. However, if you have a relatively small number of signals and they already represent useful features, then the computational costFeatureExtractionmay not be worth the benefit.
Threshold
Method to compute the detection threshold, specified as one of these values, each of which correspond to what the detection threshold is based on:
"kSigma"— Standard deviation of the normalized anomaly scores. The parameter k determines the threshold within the standard deviation levels that identifies an anomaly. The value of k is specified byThresholdParameter."contaminationFraction"— Percentage of anomalies within a specified fraction of windows, measured over the entire training set. The fraction value is specified byThresholdParameter."max"— Maximum window loss measured over the entire training data set and multiplied byThresholdParameter"mean"— Mean window loss measured over the entire training data set and multiplied byThresholdParameter"median"— Median window loss measured over the entire training data set and multiplied byThresholdParameter"manual"— Manual detection threshold value based onThreshold."customFunction"— Custom detection threshold method based onThresholdFunction.
If you specify ThresholdMethod, you can also specify
ThresholdParameter, Threshold, or ThresholdParameter. The
available threshold parameter depends on the specified detection method.
Anomaly score used to detect anomalies, specified as a positive scalar. The source
of the Threshold value depends on the setting of ThresholdMethod.
If
ThresholdMethodis"manual", you set the value.If
ThresholdMethodis"customFunction", the function specified inThresholdFunctioncomputes the value.For other values of
ThresholdMethod, useThresholdParameterto specify the detection threshold.
Parameter used for determining the detection threshold, specified as a numeric scalar.
The way you specify ThresholdParameter depends on the
specified value for ThresholdMethod. The following list describes
the specification of ThresholdParameter for each possible value
of ThresholdMethod
"kSigma"— SpecifyThresholdParameteras a positive numeric scalar. If you do not specifyThresholdParameter, the detector sets the threshold to 3."contaminationFraction"— SpecifyThresholdParameteras a as a nonnegative scalar less than 0.5. For example, if you specify"contaminationFraction"as0.05, then the threshold is set to identify the top 5% of the anomaly scores as anomalous. If you do not specifyThresholdParameter, the detector sets the threshold to 0.01."max","mean", or"median"— SpecifyThresholdParameteras a positive numeric scalar. If you do not specifyThresholdParameter, the detector sets the threshold to 1."customFunction"or"manual"—ThresholdParameterdoes not apply.
Method for computing the detection threshold, specified as one of these:
"kSigma"— Sigma-based standard deviation of the normalized anomaly scores, calculated as mean + k + standard deviation. The parameter k determines how many standard deviations above the mean the threshold is set. The value of k is specified byThresholdParameter."contaminationFraction"— Percentage of anomalies within a specified fraction of windows, measured over the entire training set. The fraction value is specified byThresholdParameter."max"— Maximum window loss measured over the entire training data set and multiplied byThresholdParameter."mean"— Mean window loss measured over the entire training data set and multiplied byThresholdParameter."median"— Median window loss measured over the entire training data set and multiplied byThresholdParameter."manual"— Manual detection threshold value based onThreshold."customFunction"— Custom detection threshold method based onThresholdFunction.
If you specify ThresholdMethod, you can also specify ThresholdParameter, Threshold, or ThresholdParameter. The available threshold parameter depends on the specified detection method.
Function to compute custom detection threshold, specified as a function handle.
This argument applies only when ThresholdMethod is
specified as "customFunction".
The input to the function must be the vector of the anomaly scores.
The function must return a positive scalar corresponding to the detection threshold.
One-Class SVM Model Options
Maximum amount of allocated memory in megabytes, specified as a positive scalar.
Kernel scale parameter, specified as "auto" or a positive
scalar. The software obtains a random basis for random feature expansion by using the
kernel scale parameter.
If you specify "auto", then the software selects an appropriate
kernel scale parameter using a heuristic procedure. This heuristic procedure uses
subsampling, so estimates can vary from one call to another. Therefore, to reproduce
results, set a random number seed by using rng before training.
Regularization term strength, specified as "auto" or a
nonnegative scalar.
If you specify "auto", then the software selects an appropriate
regularization parameter by using a heuristic procedure.
Number of dimensions in the expanded space, specified as "auto"
or a positive integer.
If you specify "auto", then the software selects an appropriate
number of dimensions using a heuristic procedure.
Relative tolerance on linear coefficients and bias term (intercept), specified as a nonnegative scalar.
This value, along with GradientTolerance, provides a stopping
criterion for optimization.
Absolute gradient tolerance, specified as a nonnegative scalar.
This value, along with BetaTolerance, provides a stopping
criterion for optimization.
Maximum number of optimization iterations, specified as a positive integer.
The default value is 1000 if the transformed data fits in
memory, as specified by the BlockSize name-value argument.
Otherwise, the default value is 100.
Normalization technique for training and testing, specified as
"zscore", "range", or "off".
"range"— Rescale the data range to [0,1]."zscore"— Distance from a data point to the mean in terms of standard deviation"off"— Do not normalize the data.
The data to which Normalization is applied depends whether
FeatureExtraction is enabled.
If
FeatureExtractionis enabled, then normalization is applied to the features.If
FeatureExtractionis disabled, then normalization is applied to the raw data.
If all the input data values are the same (the data is constant), then
normalization returns zeros. For example, if X is a vector
containing all equal values, then normalize(X) returns a vector of
the same size that contains all zeros.
For more information on normalization methods, see normalize.
Output Arguments
Anomaly detector model, returned as an TimeSeriesOCSVMDetector object.
Version History
Introduced in R2026a
See Also
train | detect | plot | plotHistogram | updateDetector
MATLAB Command
You clicked a link that corresponds to this MATLAB command:
Run the command by entering it in the MATLAB Command Window. Web browsers do not support MATLAB commands.
Web サイトの選択
Web サイトを選択すると、翻訳されたコンテンツにアクセスし、地域のイベントやサービスを確認できます。現在の位置情報に基づき、次のサイトの選択を推奨します:
また、以下のリストから Web サイトを選択することもできます。
最適なサイトパフォーマンスの取得方法
中国のサイト (中国語または英語) を選択することで、最適なサイトパフォーマンスが得られます。その他の国の MathWorks のサイトは、お客様の地域からのアクセスが最適化されていません。
南北アメリカ
- América Latina (Español)
- Canada (English)
- United States (English)
ヨーロッパ
- Belgium (English)
- Denmark (English)
- Deutschland (Deutsch)
- España (Español)
- Finland (English)
- France (Français)
- Ireland (English)
- Italia (Italiano)
- Luxembourg (English)
- Netherlands (English)
- Norway (English)
- Österreich (Deutsch)
- Portugal (English)
- Sweden (English)
- Switzerland
- United Kingdom (English)