phased.LRTDetector
Description
The likelihood ratio test (LRT) detector performs binary signal detection in the presence of noise. The binary detector chooses between the null hypothesis H0 and the alternative hypothesis H1 based on data measurements. The null hypothesis denotes the absence of any signal while the alternative hypothesis denotes the presence of some signal.
Creation
Description
detector = phased.LRTDetectordetector
System object™ with default properties.
detector = phased.LRTDetector(Name = Value)detector
System object with the specified property Name set to the specified
Value. You can specify additional name-value pair arguments in any
order as (Name1 = Value1, …
,NameN = ValueN).
Properties
Usage
Description
Input Arguments
Output Arguments
Object Functions
To use an object function, specify the
System object as the first input argument. For
example, to release system resources of a System object named obj, use
this syntax:
release(obj)
Examples
Perform likelihood ratio test detection on 10 signals in complex Gaussian noise. The input is a known signal vector of ones. The noise covariance is unity. Set the desired probability of false alarm to 0.1. Perform the detection on all samples of the input. Show that the probability of false alarm is close to the desired level.
rng default
lrt = phased.LRTDetector('DataComplexity','Complex', ...
    'ProbabilityFalseAlarm',0.1);
N = 10;
M = 1000;
x = 1/sqrt(2)*(randn(N,M) + 1i*randn(N,M));
xknown = 100*ones(N,1);
noisecov = 1;
dresult = lrt(x,xknown,noisecov);
Pfa = sum(dresult)/M
Pfa =
0.1060
Perform likelihood ratio test detection on 10 signals in real Gaussian noise. The input known signal is a vector of ones. Set the noise covariance to 1 and set the desired probability of false alarm to 0.1. Perform the detection on all samples of the input. Show that the probability of false alarm is close to the desired level.
rng default
lrt = phased.LRTDetector(DataComplexity = 'Real', ...
    ProbabilityFalseAlarm = 0.1,ThresholdOutputPort = true);
N = 10;
M = 1000;
x = randn(N,M);
xknown = 100*ones(N,1);
noisecov = 1;
[dresult,stat,th] = lrt(x,xknown,noisecov);
Display the probability of false alarm, the first 10 values of stat, and the threshold th.
Pfa = sum(dresult)/M
Pfa =
0.1060
stat(1:10)
ans = 1×10

    1.9742    2.2291    1.0325   -1.3958    0.6511   -0.3462    0.4053   -0.8368    0.9581   -0.7792
th
th =
1.2816
This example shows how to empirically compute the probability of false alarm for real-valued data in white Gaussian noise.
Determine the required signal-to-noise ratio (SNR) in decibels for the NP detector (also known as the LRT detector) when the maximum tolerable false-alarm probability is .
% Probability of false alarm
pfa = 1e-3;

% SNR threshold in dB
snrThdB = npwgnthresh(pfa,1,'real');

% SNR threshold
snrThNP = sqrt(db2pow(snrThdB));
Assume the variance is 2 and generate 1 million samples of real Gaussian noise under the null hypothesis.
rng default

% Noise variance
variance = 2;

% Number of independent samples
M = 1e6;

% Data under null hypothesis
x = sqrt(variance) * randn(1,M);
Verify empirically that the detection threshold results in the desired false-alarm rate under the null hypothesis. This can be verified by determining the proportion of normalized samples that exceed the required SNR threshold.
% Empirical false-alarm rate
falseAlarmRateNP = sum(x/sqrt(variance) > snrThNP)/M
falseAlarmRateNP = 9.9500e-04
Alternatively, use phased.LRTDetector to empirically calculate the detection result and false alarm rate. The LRT detector requires inputting the noise-free signal under the alternative hypothesis. As we test the null hypothesis, the amplitude of the noise-free signal under the alternative hypothesis is irrelevant to the testing and can be set to any real value. Set the noise-free signal under the alternative hypothesis to be 10.
% Configure the LRT detector lrt = phased.LRTDetector('DataComplexity','Real',... 'ProbabilityFalseAlarm',pfa,'ThresholdOutputPort',true); % Known noise-free signal under the alternative hypothesis xnoisefree = 10; % LRT detection [dresult,stat,snrThLRT] = lrt(x,xnoisefree,variance); % Empirical false-alarm rate falseAlarmRateLRT = sum(dresult)/M
falseAlarmRateLRT = 9.9500e-04
The false alarm rates estimated using the above two methods are consistent.
% Difference between SNR thresholds calculated by npwgnthresh and LRT detector
thmse = abs(snrThNP-snrThLRT)^2thmse = 1.9722e-31
The SNR thresholds generated from npwgnthresh and phased.LRTDetector are also consistent.
Plot the first 10,000 samples of detection statistics. The red horizontal line shows the detection threshold of the LRT detector. The yellow circle shows the detected false alarm.
% Plot detection statistics x1 = stat(1:1e4); plot(x1) % Plot detection threshold line([1 length(x1)],[snrThLRT snrThLRT],'Color','red') hold on % Plot detection results dindex = find(dresult(1:1e4)); plot(dindex,stat(dindex),'o'); xlabel('Sample') ylabel('Value')
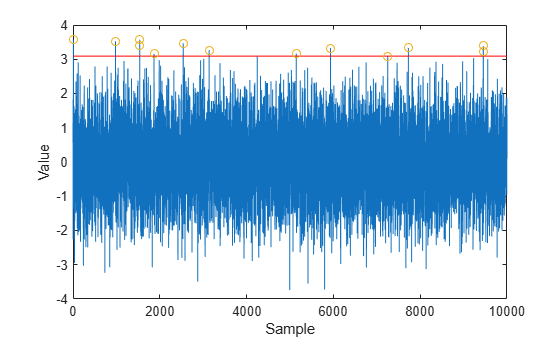
You can see that few sample values exceed the threshold. This result is expected because of the low false-alarm probability.
This example shows how to empirically verify the probability of false alarm in a system that uses coherent detection of complex-valued signals. Coherent detection means that the system utilizes information about the phase of the complex-valued signals.
Determine the required SNR for the NP detector (the LRT detector) in a coherent detection scheme with one sample. Use a maximum tolerable false-alarm probability of .
% Probability of false alarm pfa = 1e-3; % SNR threshold in dB snrThdB = npwgnthresh(pfa,1,'coherent'); % SNR threshold snrThNP = sqrt(db2pow(snrThdB));
Test that this threshold empirically results in the correct false-alarm rate. The sufficient statistic in the complex-valued case is the real part of the received sample.
rng default % Noise variance variance = 5; % Number of independent samples M = 1e6; % Data under null hypothesis x = sqrt(variance/2)*(randn(1,M)+1j*randn(1,M)); % Empirical false-alarm rate falseAlarmRateNP = sum(real(x)/sqrt(variance)>snrThNP)/M
falseAlarmRateNP =
9.9500e-04
Alternatively, use phased.LRTDetector to empirically calculate the detection result and false alarm rate. The LRT detector requires inputting the noise-free signal under the alternative hypothesis. As we test the null hypothesis, the complex amplitude of the noise-free signal under the alternative hypothesis is irrelevant to the testing and can be set to any real value. Set the noise-free signal under the alternative hypothesis to be amplitude 10 with random phase.
% Configure the LRT detector lrt = phased.LRTDetector('DataComplexity','Complex',... 'ProbabilityFalseAlarm',pfa,'ThresholdOutputPort',true); % Known noise-free signal under the alternative hypothesis xnoisefree = 10*exp(1j*2*pi*rand); % LRT detection [dresult,~,snrThLRT] = lrt(x,xnoisefree,variance); % Empirical false-alarm rate falseAlarmRateLRT = sum(dresult)/M
falseAlarmRateLRT = 9.6300e-04
The false alarm rates estimated using the above two methods are consistent.
% Difference between SNR thresholds calculated by npwgnthresh and LRT detector
thmse = abs(snrThNP-snrThLRT)^2
thmse = 0
The SNR thresholds generated from npwgnthresh and phased.LRTDetector are also consistent.
More About
References
[1] Steven M. Kay, Fundamentals of Statistical Signal Processing, Detection Theory, Prentice-Hall PTR, 1993.
[2] Mark A. Richards, Fundamentals of Radar Signal Processing, Third edition, McGraw-Hill Education, 2022.
Extended Capabilities
Version History
Introduced in R2023b
See Also
npwgnthresh | rocsnr | rocpfa | phased.GLRTDetector | phased.CFARDetector | phased.CFARDetector2D