voronoi
2 次元空間でのボロノイ線図のプロット
説明
例
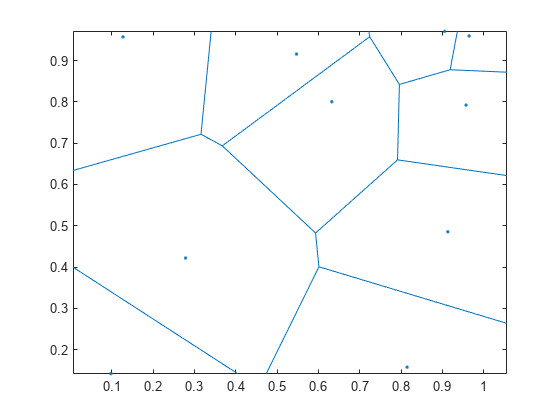
2 次元の点座標 10 点を含む 2 つのベクトルを作成し、ボロノイ線図をプロットします。
rng default;
x = rand([1 10]);
y = rand([1 10]);
voronoi(x,y)
axis equal
入力引数
出力引数
詳細
拡張機能
バージョン履歴
R2006a より前に導入
2 次元空間でのボロノイ線図のプロット
2 次元の点座標 10 点を含む 2 つのベクトルを作成し、ボロノイ線図をプロットします。
rng default; x = rand([1 10]); y = rand([1 10]); voronoi(x,y) axis equal
R2006a より前に導入