timeseries2timetable
timeseries オブジェクトの timetable への変換
説明
TT = timeseries2timetable( は ts)timeseries オブジェクトを timetable に変換します。
tsがtimeseriesオブジェクトの場合、TTは 1 つの変数をもつ timetable です。tsがtimeseriesオブジェクトの配列の場合、TTはts内のtimeseriesオブジェクトと同数の変数をもつ timetable です。ts内のすべてのtimeseriesオブジェクトのサンプル時間は同じでなければなりません。いずれかの
timeseriesオブジェクトがイベントをもつ場合、この関数はイベントをイベント テーブルに変換し、そのイベント テーブルをTTに付加します。イベントが重複すると、イベント テーブルの行が重複します。 (R2024b 以降)
例
10 秒間隔でサンプリングされた 5 つの乱数をもつ timeseries オブジェクトを作成します。
ts = timeseries(rand(5,1),[0 10 20 30 40])
  timeseries

  Common Properties:
            Name: 'unnamed'
            Time: [5x1 double]
        TimeInfo: [1x1 tsdata.timemetadata]
            Data: [5x1 double]
        DataInfo: [1x1 tsdata.datametadata]

  More properties, Methods
ts 内の時間およびデータを表示します。
ts.Time
ans = 5×1

     0
    10
    20
    30
    40
ts.Data
ans = 5×1

    0.8147
    0.9058
    0.1270
    0.9134
    0.6324
ts を timetable に変換します。
TT = timeseries2timetable(ts)
TT=5×1 timetable
     Time      Data
    ______    _______

    0 sec     0.81472
    10 sec    0.90579
    20 sec    0.12699
    30 sec    0.91338
    40 sec    0.63236
timeseries オブジェクトの配列を作成します。サンプル時間と同じベクトルを使用しますが、時系列を異なる名前にします。関数 rand を使用して、異なるデータ値の配列を作成します。
ts1 = timeseries(rand(5,1),[0 10 20 30 40],"Name","Series_1");
ts2 = timeseries(rand(5,1),[0 10 20 30 40],"Name","Series_2");
ts3 = timeseries(rand(5,1),[0 10 20 30 40],"Name","Series_3");
ts = [ts1 ts2 ts3]
  1×3 timeseries array with properties:

    Events
    Name
    UserData
    Data
    DataInfo
    Time
    TimeInfo
    Quality
    QualityInfo
    IsTimeFirst
    TreatNaNasMissing
    Length
すべての timeseries オブジェクトのデータを 1 つの timetable に結合します。配列内の各時系列は 1 つの変数を timetable に提供します。
TT = timeseries2timetable(ts)
TT=5×3 timetable
     Time     Series_1    Series_2    Series_3
    ______    ________    ________    ________

    0 sec     0.81472     0.09754     0.15761
    10 sec    0.90579      0.2785     0.97059
    20 sec    0.12699     0.54688     0.95717
    30 sec    0.91338     0.95751     0.48538
    40 sec    0.63236     0.96489     0.80028
複数の timeseries オブジェクトを timetable に変換します。
ts1 = timeseries(rand(5,1),[0 10 20 30 40],"Name","Series_1");
ts2 = timeseries(rand(5,1),[0 10 20 30 40],"Name","Series_2");
ts3 = timeseries(rand(5,1),[0 10 20 30 40],"Name","Series_3");
TT = timeseries2timetable(ts1,ts2,ts3)
TT=5×3 timetable
     Time     Series_1    Series_2    Series_3
    ______    ________    ________    ________

    0 sec     0.81472     0.09754     0.15761
    10 sec    0.90579      0.2785     0.97059
    20 sec    0.12699     0.54688     0.95717
    30 sec    0.91338     0.95751     0.48538
    40 sec    0.63236     0.96489     0.80028
3 つの都市交差点の車両交通量データをもつ 3 つの timeseries オブジェクトを読み込みます。
load trafficCounts.mat count1 count2 count3
最初の timeseries オブジェクトのプロパティを表示します。これらのプロパティには、交通量データ、データが収集された時刻、および 2 つのイベントが格納されています。イベントは tsdata.event オブジェクトです。
count1
  timeseries

  Common Properties:
            Name: 'Intersection1'
            Time: [15x1 double]
        TimeInfo: [1x1 tsdata.timemetadata]
            Data: [15x1 double]
        DataInfo: [1x1 tsdata.datametadata]
          Events: [1x2 tsdata.event]

  More properties, Methods
count1 に付加されている最初のイベントを表示します。
count1.Events(1)
    EventData: []
         Name: 'AMCommute'
         Time: 8
        Units: 'hours'
    StartDate: ''
2 番目のイベントを表示します。イベントは、朝と夕方の通勤時間を示しています。
count1.Events(2)
    EventData: []
         Name: 'PMCommute'
         Time: 18
        Units: 'hours'
    StartDate: ''
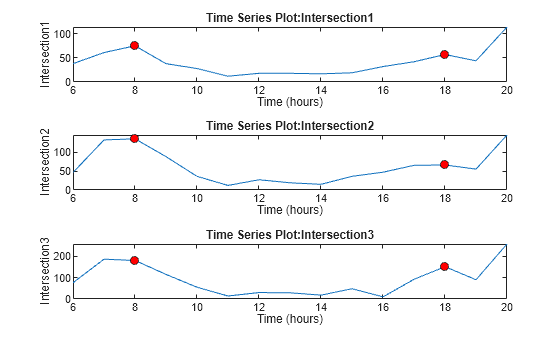
3 つの timeseries オブジェクトからデータをプロットします。サブプロットで時系列を表示するタイル表示チャート レイアウトを作成するために、tiledlayout 関数を使用します。チャートには、3 つの時系列に関連付けられたイベントを示す赤い点が表示されます。
tiledlayout(3,1)
nexttile
plot(count1)
nexttile
plot(count2)
nexttile
plot(count3)
3 つの timeseries オブジェクトを 1 つの timetable に変換します。行時間の形式を hh:mm 形式に設定します。イベントは 3 つの時系列で同じ時刻に発生するため、timetable には 08:00 と 18:00 の両方に 3 つのイベントのラベルがあります。
TT = timeseries2timetable(count1,count2,count3);
TT.Time.Format = "hh:mm"TT=15×3 timetable with 6 events
Time Intersection1 Intersection2 Intersection3
_____ _____________ _____________ _____________
06:00 38 46 76
07:00 61 132 186
<3 events> 08:00 75 135 180
09:00 38 88 115
10:00 28 36 55
11:00 12 12 14
12:00 18 27 30
13:00 18 19 29
14:00 17 15 18
15:00 19 36 48
16:00 32 47 10
17:00 42 65 92
<3 events> 18:00 57 66 151
19:00 44 55 90
20:00 114 145 257
この変換では、イベント オブジェクトもイベント テーブルに変換されます。イベント テーブルは timetable に付加されます。イベント テーブルでは、2 つの時刻に 3 つの同一イベントがあることが示されています。
TT.Properties.Events
ans = 6×1 eventtable
  Event Labels Variable: EventLabels
  Event Lengths Variable: <instantaneous>

    Time     EventLabels
    _____    ___________

    8 hr     "AMCommute"
    8 hr     "AMCommute"
    8 hr     "AMCommute"
    18 hr    "PMCommute"
    18 hr    "PMCommute"
    18 hr    "PMCommute"
繰り返しイベントがあるイベント テーブルをクリーニングできます。1 つの方法は、unique 関数を使用することです。
ET = TT.Properties.Events;
ET = unique(ET)
ET = 2×1 eventtable
  Event Labels Variable: EventLabels
  Event Lengths Variable: <instantaneous>

    Time     EventLabels
    _____    ___________

    8 hr     "AMCommute"
    18 hr    "PMCommute"
クリーニングしたイベント テーブルを timetable に付加します。timetable を表示します。
TT.Properties.Events = ET
TT=15×3 timetable with 2 events
                 Time     Intersection1    Intersection2    Intersection3
                 _____    _____________    _____________    _____________

                 06:00          38               46               76
                 07:00          61              132              186
    AMCommute    08:00          75              135              180
                 09:00          38               88              115
                 10:00          28               36               55
                 11:00          12               12               14
                 12:00          18               27               30
                 13:00          18               19               29
                 14:00          17               15               18
                 15:00          19               36               48
                 16:00          32               47               10
                 17:00          42               65               92
    PMCommute    18:00          57               66              151
                 19:00          44               55               90
                 20:00         114              145              257
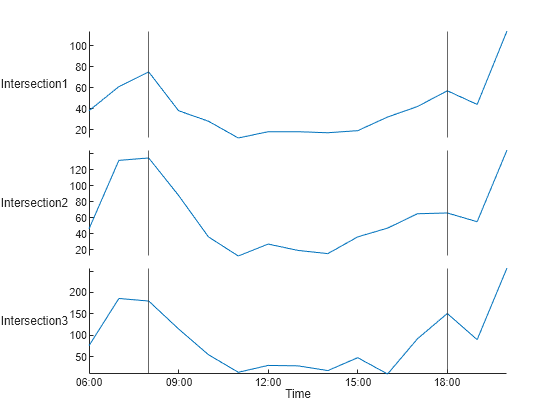
timetable 内の交通量データのチャートを作成します。最初に、新しい Figure ウィンドウを作成して、tiledlayout によって作成されたサブプロットを再利用しないようにします。次に、timetable からのデータをプロットするために、stackedplot を使用します。stackedplot 関数は、各 timetable 変数をサブプロットにプロットし、イベントが発生した時刻に黒の垂直線を表示します。
figure
stackedplot(TT)