linkaxes
複数の座標軸の範囲の同期
説明
linkaxes( は、指定された座標軸のベクトルの範囲を同期します。範囲を同期すると、1 つのプロットまたは Figure 内でズームまたはパンを行ったり、同じ範囲のデータを他のプロットまたは Figure に表示したりできます。ax)linkaxes 関数の最初の呼び出し時は、指定したすべての座標軸の現在の範囲を内包する新しい範囲が選択されます。
R2026a より前: linkaxes 関数を呼び出すと、それより前の関数の呼び出しで作成されたリンクはすべてキャンセルされます。たとえば、linkaxes([ax1 ax2]) を呼び出してから linkaxes([ax2 ax3]) を呼び出すと、2 番目の呼び出しによって ax1 と ax2 の間のリンクはキャンセルされます。
例
関数 tiledlayout および nexttile を使用して、プロットをタイル表示します。
関数 tiledlayout を使用して、3 行 1 列のタイル表示チャート レイアウトを作成します。次に、nexttile 関数を使用して axes オブジェクト ax1、ax2、ax3 を作成し、各 axes オブジェクトにプロットします。
tiledlayout(3,1)

% First plot
ax1 = nexttile;
x1 = linspace(0,6);
y1 = sin(x1);
plot(x1,y1)

% Second plot
ax2 = nexttile;
x2 = linspace(0,10);
y2 = 2*sin(2*x2);
plot(x2,y2)

% Third plot
ax3 = nexttile;
x3 = linspace(0,12,200);
y3 = 4*sin(6*x3);
plot(x3,y3)

3 つのプロットの座標軸の範囲を同期します。新しい軸の範囲に古い範囲が内包されていることに注意してください。
linkaxes([ax1 ax2 ax3])

1 番目のプロットの x 軸の範囲を設定します。すべての "x" 軸がリンクされているため、2 番目と 3 番目のプロットの "x" 軸の範囲も変化します。
ax1.XLim = [0 4.5];

プロットの 1 つに移動するかズームすると、他の 2 つのプロットに同じデータの範囲が表示されます。
リンクを削除するには、linkaxes([ax1 ax2 ax3],"off") を使用します。
関数 linkaxes を使用して、複数の axes オブジェクトの x 軸の範囲を同期および変更します。
関数 tiledlayout および nexttile を使用して、プロットをタイル表示します。関数 tiledlayout を使用して、2 行 1 列のタイル表示チャート レイアウトを作成します。次に、nexttile 関数を使用して axes オブジェクト ax1 と ax2 を作成し、各 axes オブジェクトにプロットします。
t = tiledlayout(2,1);

% First plot
ax1 = nexttile;
p1 = peaks;
surf(ax1,p1)
view(3)

% Second plot
ax2 = nexttile;
p2 = peaks(25);
mesh(ax2,p2)

2 つの axes オブジェクトの x 軸の範囲を同期します。新しくリンクされた axes オブジェクトの "x" 軸の範囲が更新され、すべてのデータが含まれるようになります。
linkaxes([ax1 ax2],"x")リンクされたすべての axes オブジェクトの x 軸の範囲を更新するには、axes オブジェクトのうちどれか 1 つで x 軸の範囲を設定します。
ax1.XLim = [0 15];
ax2.XLim
ans = 1×2

     0    15
同期をオフにすると、リンクが削除されます。
linkaxes([ax1 ax2],"off")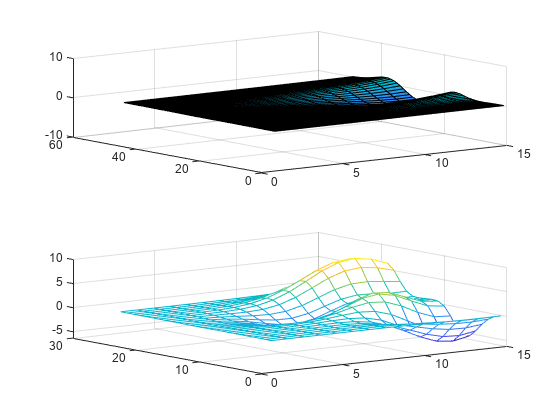
タイム ゾーンが異なる datetime 値の 2 つのプロットを比較する場合は、いずれかのルーラーの ReferenceDate プロパティを設定して、両方のプロットが同じタイム ゾーンを表すようにします。
2021 年 1 月 1 日にロンドンとニューヨークで新年を祝ってお祭り騒ぎしている人々の数を比較する 2 つのプロットのタイル表示を作成します。まずは最初のタイルにロンドンのデータをプロットします。既定では、プロットはデータのタイム ゾーンを使用します。
London = datetime(2021,1,1,0:17,0,0,"TimeZone","Europe/London");
y = (1./(1:18).^2) * 100000;
ax1 = nexttile;
semilogy(ax1,London,y)
grid on
title("New Year's Day Revelers in London")

ニューヨークのデータをプロットします。この 2 番目のプロットはニューヨークのタイム ゾーンです。そのため、視覚的な確認では、同じ時点における 2 つの場所でのお祭り騒ぎしている人々の数を簡単には比較できません。
NY = datetime(2021,1,1,0:17,0,0,"TimeZone","America/New_York");
ax2 = nexttile;
semilogy(ax2,NY,y)
grid on
title("New Year's Day Revelers in New York")

x 軸の基準日を "Europe/London" のタイム ゾーンの datetime 値に設定することで、ニューヨークのプロットのタイム ゾーンを変更します。次に、2 つの座標軸をリンクします。結果として、両方のプロットで同じタイム ゾーンが表されるようになります。
ax2.XAxis.ReferenceDate = datetime(2022,1,1,"TimeZone","Europe/London");
linkaxes([ax1,ax2],"x")

入力引数
バージョン履歴
R2006a より前に導入参考
linkprop | linkdata | tiledlayout | nexttile