colorcube
colorcube カラーマップ配列
説明
例
カラーマップのセクションの使用
カラーマップ配列の取得後に、配列のセクションを分離してカラー スキームとして使用できます。
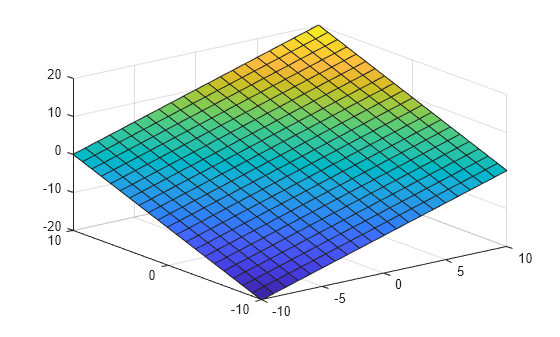
平面の表面プロットを作成します。
[X,Y] = meshgrid(-10:1:10); Z = X + Y; surf(X,Y,Z);
colorcube カラーマップ配列を取得し、赤色セクションを分離します (エントリ 39 ~ 44)。次に、このセクションを使用して表面全体を着色します。
c = colorcube; c = c(39:44,:); colormap(c);
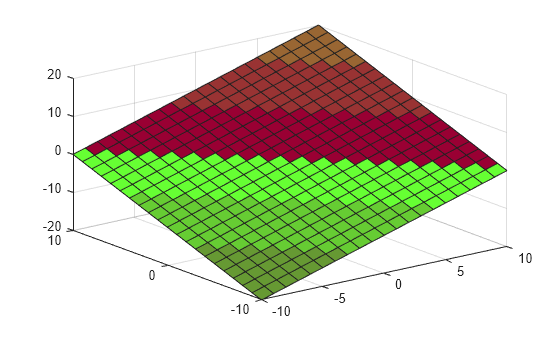
colorcube カラーマップを使用した平面の着色
平面の表面プロットを作成します。
[X,Y] = meshgrid(-10:1:10); Z = X + Y; surf(X,Y,Z);
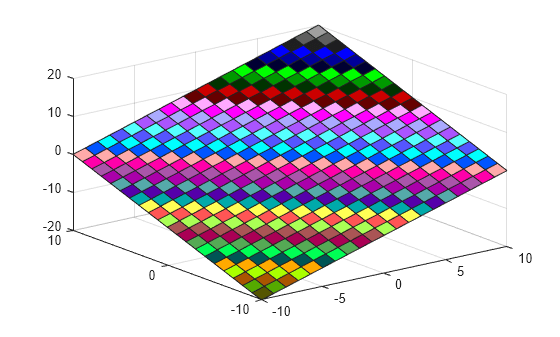
75 個のエントリをもつ colorcube カラーマップを取得します。次に、そのカラーマップを使用して平面を着色します。
c = colorcube(75); colormap(c);
入力引数
m
— 色数
256
(既定値) | 非負の整数
色数。非負の整数として指定します。m
の既定値は現在の Figure のカラーマップの色の数です。Figure が存在しない場合、既定値は 256
です。
データ型: single
| double
バージョン履歴
R2006a より前に導入R2019b: カラーマップは既定で 256 色
R2019b 以降、カラーマップは既定で 256 色です。
R2019a およびそれ以前のリリースでの既定サイズは 64 です。コードが 64 色のカラーマップに依存する場合は、Figure、座標軸、またはチャートのカラーマップを設定するときに色数を指定します。たとえば、colormap(colorcube(64))
は、Figure のカラーマップを 64 色の colorcube
カラーマップに設定します。
あるいは、MATLAB® セッション内のすべての Figure について、既定のカラーマップを変更できます。
set(groot,'defaultFigureColormap',colorcube(64))
MATLAB コマンド
次の MATLAB コマンドに対応するリンクがクリックされました。
コマンドを MATLAB コマンド ウィンドウに入力して実行してください。Web ブラウザーは MATLAB コマンドをサポートしていません。
Select a Web Site
Choose a web site to get translated content where available and see local events and offers. Based on your location, we recommend that you select: .
You can also select a web site from the following list:
How to Get Best Site Performance
Select the China site (in Chinese or English) for best site performance. Other MathWorks country sites are not optimized for visits from your location.
Americas
- América Latina (Español)
- Canada (English)
- United States (English)
Europe
- Belgium (English)
- Denmark (English)
- Deutschland (Deutsch)
- España (Español)
- Finland (English)
- France (Français)
- Ireland (English)
- Italia (Italiano)
- Luxembourg (English)
- Netherlands (English)
- Norway (English)
- Österreich (Deutsch)
- Portugal (English)
- Sweden (English)
- Switzerland
- United Kingdom (English)