Create a Simple Animation
Animations are an effective way to visualize data changing over time. This example shows the basic steps for creating a simple animation. For more ways to create animations, see Animation Techniques.
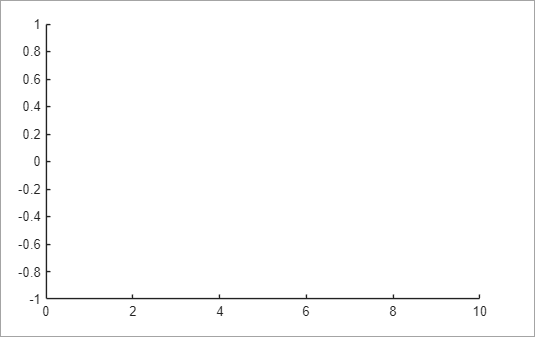
Set Up Figure and Axes
Start by setting up the figure and axes for your animation. Use the xlim, ylim, and zlim functions to set the limits of
each axis. Setting the limits disables the automatic axis limits calculation, which
can cause the animation to flicker and slow down.
figure
xlim([0 10])
ylim([-1 1])
zlim([-1 1])
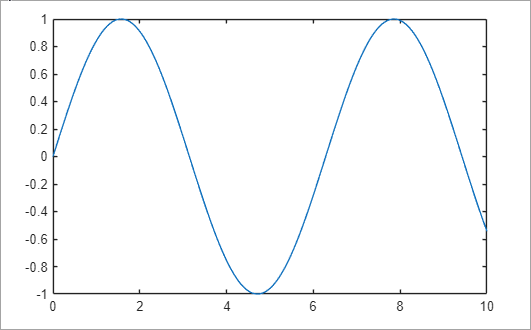
Initialize Objects
Create the objects you want to animate. For example, to create an animation of a marker moving along a sine wave, first plot the wave. Then create a marker and save it to a variable so that you can access its properties later.
x = linspace(0,10,500);
y = sin(x);

plot(x,y)
hold on
mkr = scatter(NaN,NaN,[],"red","filled");
hold off
Create Loop to Update Animation
Use a loop to update the properties of your objects. This loop defines how your
objects change over time. In some cases, MATLAB® does not update the screen until the code finishes executing. Use the
drawnow function to display the
updates on the screen throughout an animation.
for i = 1:length(x)
    mkr.XData = x(i);
    mkr.YData = y(i);
    drawnow
end

Control Speed
To control the speed of the animation, use the pause function after updating the
figure data. Adjust the pause duration to control how fast the
animation plays. For example, use pause with a duration of 0.05
seconds in the loop to slow the animation down. The pause
function updates the figure, so you do not need to use the
drawnow function to force an update.
for i = 1:length(x)
    mkr.XData = x(i);
    mkr.YData = y(i);
    pause(0.05)
end
Optimize Performance
There are several techniques for optimizing the performance of animations. For
example, when creating line animations, you can use the animatedline function, which is
optimized for creating line animations of streaming data. You also can improve the
performance of animations using general graphics techniques, such as disabling the
automatic axis limits calculation and strategically limiting the use of the
drawnow function.
For more information, see Improve Graphics Performance.
Save Animations
You can record and playback animations using the getframe and
movie functions. You also can save an animation to a GIF
file using the exportgraphics function. For more information
and examples, see Animation Techniques.
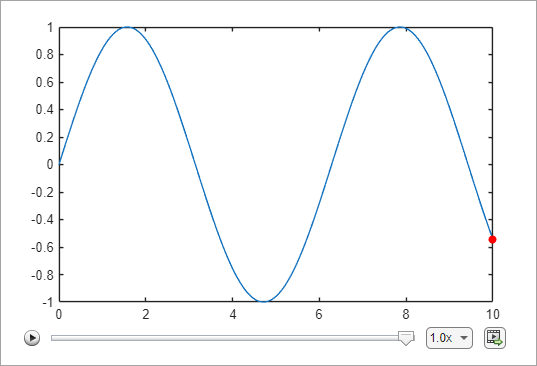
In live scripts, playback controls appear within the figure window after an
animation is done playing. You can use these playback controls to replay the
animation and explore individual frames without having to rerun the entire live
script. To export animations in live scripts to movies or animated GIF files, use
the Export Animation button ![]() in the animation playback controls. Animation
playback controls do not appear for animations with 10 or fewer frames, and are not
supported for animations generated by the
in the animation playback controls. Animation
playback controls do not appear for animations with 10 or fewer frames, and are not
supported for animations generated by the movie
function.
For example, if you run the sine wave animation in a live script, playback controls appear within the figure window after the animation finishes.
See Also
Functions
drawnow|pause|exportgraphics|getframe|movie