Main Content
Visualization and Verification
Visualize neural network behavior, explain predictions, and verify robustness
using sequence and tabular data
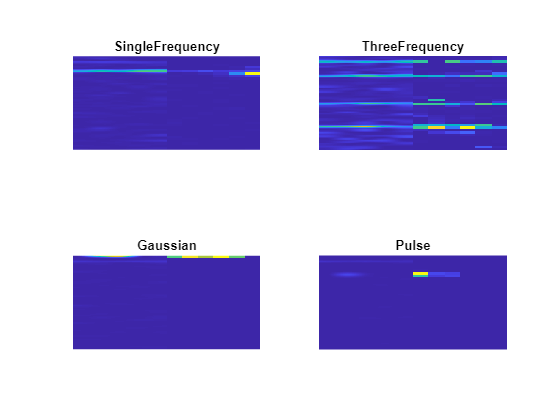
Visualize deep networks during and after training. Monitor training progress using built-in plots of network accuracy and loss. To investigate trained networks, you can use visualization techniques such as Grad-CAM.
Use deep learning verification methods to assess the properties of deep neural networks. For example, you can verify the robustness properties of a network, compute network output bounds, and find adversarial examples.
Apps
| Deep Network Designer | Design and visualize deep learning networks |
Functions
Properties
| ConfusionMatrixChart Properties | Confusion matrix chart appearance and behavior |
| ROCCurve Properties | Receiver operating characteristic (ROC) curve appearance and behavior (Since R2022b) |
Topics
Interpretability
- Visualize Activations of LSTM Network
This example shows how to investigate and visualize the features learned by LSTM networks by extracting the activations. - Interpret Deep Learning Time-Series Classifications Using Grad-CAM
This example shows how to use the gradient-weighted class activation mapping (Grad-CAM) technique to understand the classification decisions of a 1-D convolutional neural network trained on time-series data. - View Network Behavior Using tsne
This example shows how to use thetsnefunction to view activations in a trained network. - Deep Learning in MATLAB
Discover deep learning capabilities in MATLAB® using convolutional neural networks for classification and regression, including pretrained networks and transfer learning, and training on GPUs, CPUs, clusters, and clouds. - Deep Learning Tips and Tricks
Learn how to improve the accuracy of deep learning networks.
Training Progress and Performance
- Monitor Deep Learning Training Progress
This example shows how to monitor the training progress of deep learning networks. - Monitor Custom Training Loop Progress
Track and plot custom training loop progress. - ROC Curve and Performance Metrics
Userocmetricsto examine the performance of a classification algorithm on a test data set.


