このページは前リリースの情報です。該当の英語のページはこのリリースで削除されています。
予測用の多出力ネットワークの組み立て
この例では、予測用の複数の出力ネットワークを組み立てる方法を説明します。
予測用の dlnetwork オブジェクトを使用する代わりに、関数 assembleNetwork を使用して、予測の準備が整っている DAGNetwork 内にネットワークを組み立てることができます。これにより、データストアなどの他のデータ型で関数 predict を使用できます。
モデル関数とパラメーターの読み込み
MAT ファイル dlnetDigits.mat からモデル パラメーターを読み込みます。MAT ファイルには、カテゴリカル ラベルのスコアと数字イメージの回転角度の両方を予測する dlnetwork オブジェクト、ならびにクラス名が含まれます。
s = load("dlnetDigits.mat");
net = s.net;
classNames = s.classNames;
予測用のネットワークの組み立て
関数 layerGraph を使用して、dlnetwork オブジェクトから層グラフを抽出します。
lgraph = layerGraph(net);
層グラフに出力層は含まれません。関数 addLayers および connectLayers を使用し、層グラフに分類層と回帰層を追加します。
layers = classificationLayer(Classes=classNames,Name="coutput");
lgraph = addLayers(lgraph,layers);
lgraph = connectLayers(lgraph,"softmax","coutput");

layers = regressionLayer(Name="routput");
lgraph = addLayers(lgraph,layers);
lgraph = connectLayers(lgraph,"fc2","routput");
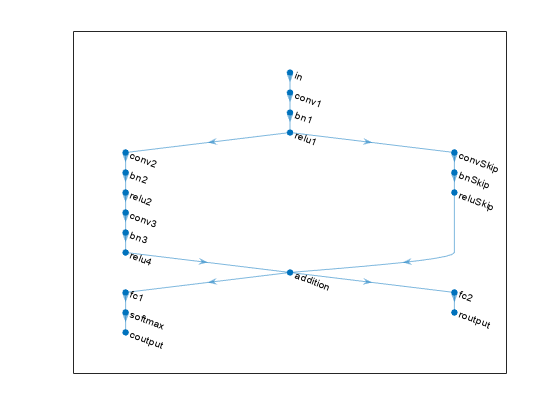
ネットワークのプロットを表示します。
figure
plot(lgraph)
関数 assembleNetwork を使用してネットワークを組み立てます。
net = assembleNetwork(lgraph)
net =
  DAGNetwork with properties:

         Layers: [19x1 nnet.cnn.layer.Layer]
    Connections: [19x2 table]
     InputNames: {'in'}
    OutputNames: {'coutput'  'routput'}
新しいデータの予測の実行
テスト データを読み込みます。
[XTest,T1Test,T2Test] = digitTest4DArrayData;
組み立てたネットワークを使用して予測を行うには、関数 predict を使用します。分類出力のカテゴリカル ラベルを返すには、ReturnCategorical オプションを true に設定します。
[Y1Test,Y2Test] = predict(net,XTest,ReturnCategorical=true);
分類精度を評価します。
accuracy = mean(Y1Test==T1Test)
accuracy = 0.9870
回帰精度を評価します。
angleRMSE = sqrt(mean((Y2Test - T2Test).^2))
angleRMSE = single
    6.0091
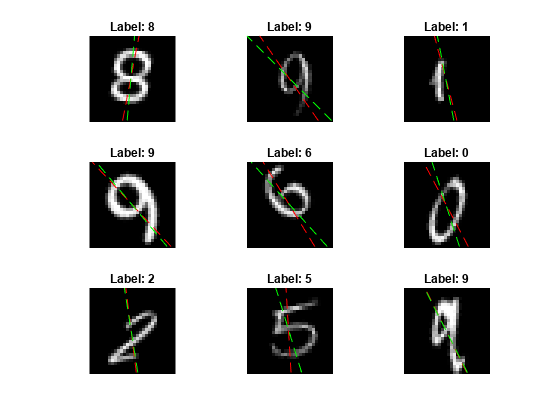
一部のイメージと、その予測を表示します。予測角度を赤、正解ラベルを緑で表示します。
idx = randperm(size(XTest,4),9);
figure
for i = 1:9
    subplot(3,3,i)
    I = XTest(:,:,:,idx(i));
    imshow(I)
    hold on

    sz = size(I,1);
    offset = sz/2;

    thetaPred = Y2Test(idx(i));
    plot(offset*[1-tand(thetaPred) 1+tand(thetaPred)],[sz 0],"r--")

    thetaValidation = T2Test(idx(i));
    plot(offset*[1-tand(thetaValidation) 1+tand(thetaValidation)],[sz 0],"g--")

    hold off
    label = string(Y1Test(idx(i)));
    title("Label: " + label)
end
参考
convolution2dLayer | batchNormalizationLayer | reluLayer | fullyConnectedLayer | softmaxLayer | assembleNetwork | predict
関連するトピック
You can also select a web site from the following list:
Americas
- América Latina (Español)
- Canada (English)
- United States (English)
Europe
- Belgium (English)
- Denmark (English)
- Deutschland (Deutsch)
- España (Español)
- Finland (English)
- France (Français)
- Ireland (English)
- Italia (Italiano)
- Luxembourg (English)
- Netherlands (English)
- Norway (English)
- Österreich (Deutsch)
- Portugal (English)
- Sweden (English)
- Switzerland
- United Kingdom (English)