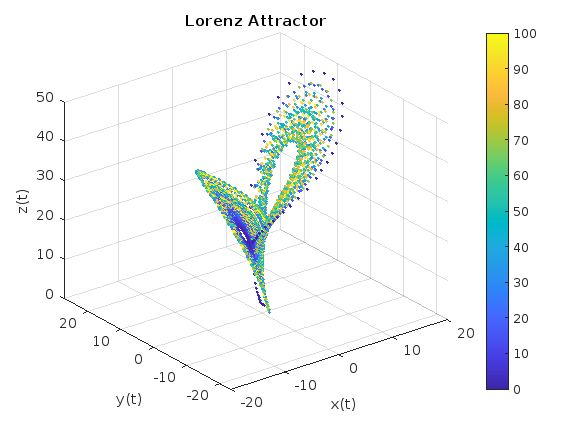
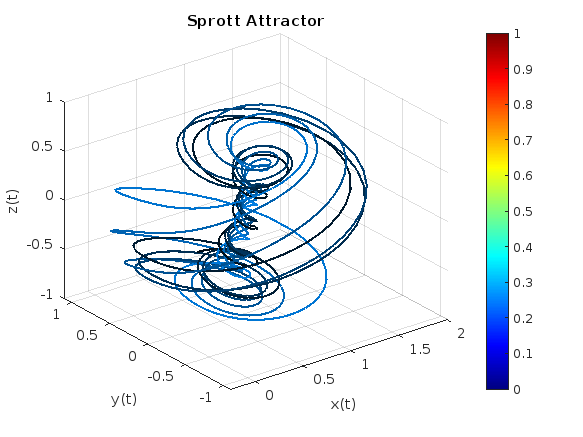
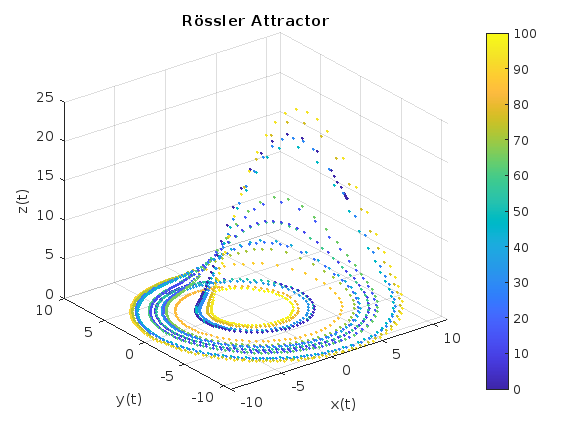
An attractor is called strange if it has a fractal structure, that is if it has non-integer Hausdorff dimension. This is often the case when the dynamics on it are chaotic, but strange nonchaotic attractors also exist. If a strange attractor is chaotic, exhibiting sensitive dependence on initial conditions, then any two arbitrarily close alternative initial points on the attractor, after any of various numbers of iterations, will lead to points that are arbitrarily far apart (subject to the confines of the attractor), and after any of various other numbers of iterations will lead to points that are arbitrarily close together. Thus a dynamic system with a chaotic attractor is locally unstable yet globally stable: once some sequences have entered the attractor, nearby points diverge from one another but never depart from the attractor.
The term strange attractor was coined by David Ruelle and Floris Takens to describe the attractor resulting from a series of bifurcations of a system describing fluid flow. Strange attractors are often differentiable in a few directions, but some are like a Cantor dust, and therefore not differentiable. Strange attractors may also be found in the presence of noise, where they may be shown to support invariant random probability measures of Sinai–Ruelle–Bowen type.
Imagine that the earth is a perfect sphere with a radius of 6371000 meters and there is a rope tightly wrapped around the equator. With one line of MATLAB code determine how much the rope will be lifted above the surface if you cut it and insert a 1 meter segment of rope into it (and then expand the whole rope back into a circle again, of course).
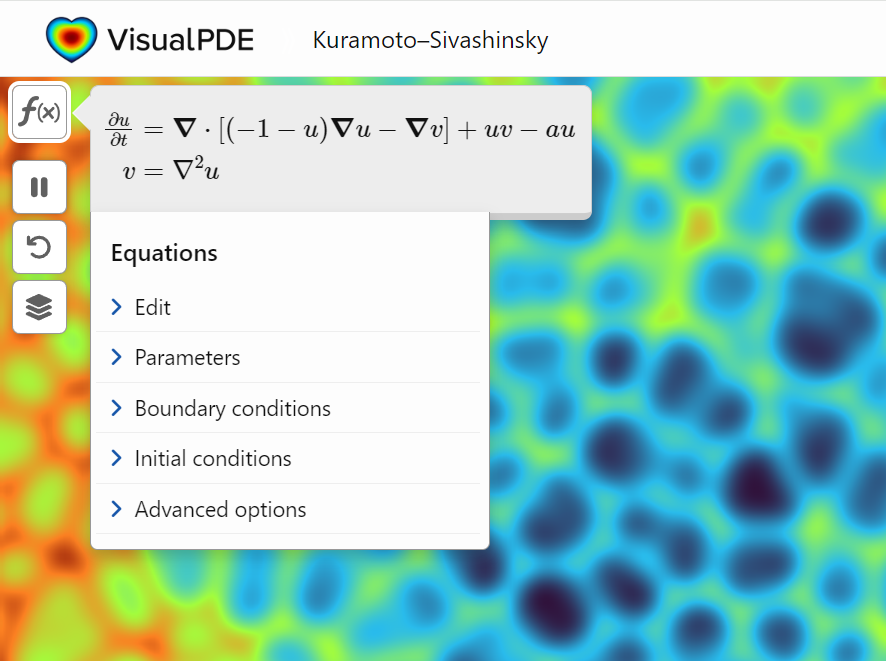
A library of runnable PDEs. See the equations! Modify the parameters! Visualize the resulting system in your browser! Convenient, fast, and instructive.
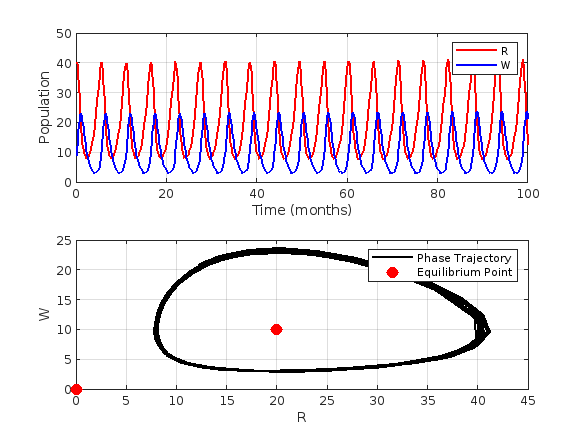
This project discusses predator-prey system, particularly the Lotka-Volterra equations,which model the interaction between two sprecies: prey and predators. Let's solve the Lotka-Volterra equations numerically and visualize the results.% Define parameters
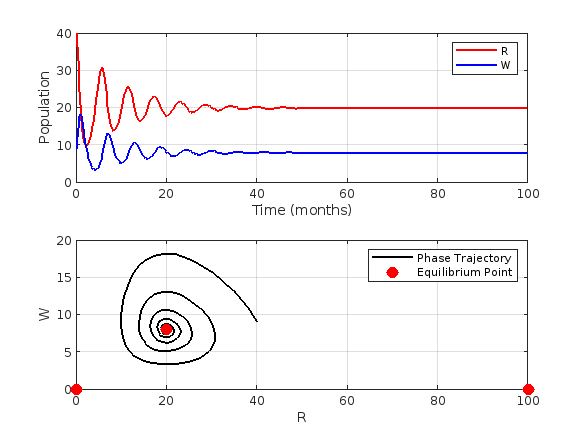
Now, we need to handle a modified version of the Lotka-Volterra equations. These modified equations incorporate logistic growth fot the prey population.
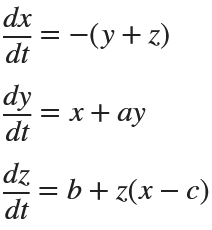
These equations are:
% Define parameters
alpha = 1.0;
K = 100; % Carrying Capacity of the prey population
Does your company or organization require that all your Word Documents and Excel workbooks be labeled with a Microsoft Azure Information Protection label or else they can't be saved? These are the labels that are right below the tool ribbon that apply a category label such as "Public", "Business Use", or "Highly Restricted". If so, you can either
Create and save a "template file" with the desired label and then call copyfile to make a copy of that file and then write your results to the new copy, or
If using Windows you can create and/or open the file using ActiveX and then apply the desired label from your MATLAB program's code.
For #1 you can do
copyfile(templateFileName, newDataFileName);
writematrix(myData, newDataFileName);
If the template has the AIP label applied to it, then the copy will also inherit the same label.
For #2, here is a demo for how to apply the code using ActiveX.
% Test to set the Microsoft Azure Information Protection label on an Excel workbook.
% Save this workbook with the new AIP setting we just created.
Excel.ActiveWorkbook.Save;
% Shut down Excel.
Excel.ActiveWorkbook.Close;
Excel.Quit;
% Excel is now closed down. Delete the variable from the MATLAB workspace.
clear Excel;
% Now check to see if the AIP label has been set
% by opening up the file in Excel and looking at the AIP banner.
winopen(excelFullFileName)
Note that there is a line in there that gets an AIP label from the existing workbook, if there is one at all. If there is not one, you can set one. But to determine what the proper LabelId (that crazy long hexadecimal number) should be, you will probably need to open an existing document that already has the label that you want set (applied to it) and then read that label with this line:
This stems purely from some play on my part. Suppose I asked you to work with the sequence formed as 2*n*F_n + 1, where F_n is the n'th Fibonacci number? Part of me would not be surprised to find there is nothing simple we could do. But, then it costs nothing to try, to see where MATLAB can take me in an explorative sense.
n = sym(0:100).';
Fn = fibonacci(n);
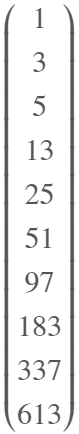
Sn = 2*n.*Fn + 1;
Sn(1:10) % A few elements
ans =
For kicks, I tried asking ChatGPT. Giving it nothing more than the first 20 members of thse sequence as integers, it decided this is a Perrin sequence, and gave me a recurrence relation, but one that is in fact incorrect. Good effort from the Ai, but a fail in the end.
Is there anything I can do? Try null! (Look carefully at the array generated by Toeplitz. It is at least a pretty way to generate the matrix I needed.)
X = toeplitz(Sn,[1,zeros(1,4)]);
rank(X(5:end,:))
ans = 5
Hmm. So there is no linear combination of those columns that yields all zeros, since the resulting matrix was full rank.
X = toeplitz(Sn,[1,zeros(1,5)]);
rank(X(6:end,:))
ans = 5
But if I take it one step further, we see the above matrix is now rank deficient. What does that tell me? It says there is some simple linear combination of the columns of X(6:end,:) that always yields zero. The previous test tells me there is no shorter constant coefficient recurrence releation, using fewer terms.
null(X(6:end,:))
ans =
Let me explain what those coefficients tell me. In fact, they yield a very nice recurrence relation for the sequence S_n, not unlike the original Fibonacci sequence it was based upon.
where the first 5 members of that sequence are given as [1 3 5 13 25]. So a 6 term linear constant coefficient recurrence relation. If it reminds you of the generating relation for the Fibonacci sequence, that is good, because it should. (Remember I started the sequence at n==0, IF you decide to test it out.) We can test it out, like this:
SfunM = memoize(@(N) Sfun(N));
SfunM(25)
ans = 3751251
2*25*fibonacci(sym(25)) + 1
ans =
3751251
And indeed, it works as expected.
function Sn = Sfun(n)
switch n
case 0
Sn = 1;
case 1
Sn = 3;
case 2
Sn = 5;
case 3
Sn = 13;
case 4
Sn = 25;
otherwise
Sn = Sfun(n-5) + Sfun(n-4) - 3*Sfun(n-3) - Sfun(n-2) +3*Sfun(n-1);
end
end
A beauty of this, is I started from nothing but a sequence of integers, derived from an expression where I had no rational expectation of finding a formula, and out drops something pretty. I might call this explorational mathematics.
The next step of course is to go in the other direction. That is, given the derived recurrence relation, if I substitute the formula for S_n in terms of the Fibonacci numbers, can I prove it is valid in general? (Yes.) After all, without some proof, it may fail for n larger than 100. (I'm not sure how much I can cram into a single discussion, so I'll stop at this point for now. If I see interest in the ideas here, I can proceed further. For example, what was I doing with that sequence in the first place? And of course, can I prove the relation is valid? Can I do so using MATLAB?)
(I'll be honest, starting from scratch, I'm not sure it would have been obvious to find that relation, so null was hugely useful here.)
hello i found the following tools helpful to write matlab programs. copilot.microsoft.com chatgpt.com/gpts gemini.google.com and ai.meta.com. thanks a lot and best wishes.
I've recently joined a forest protection team in Greece, where we use drones for various tasks. This has sparked my interest in drone programming, and I'd like to learn more about it. Can anyone recommend any beginner-friendly courses or programs that teach drone programming?
I'm particularly interested in courses that focus on practical applications and might align with the work we do in forest protection. Any suggestions or guidance would be greatly appreciated!
"What are your favorite features or functionalities in MATLAB, and how have they positively impacted your projects or research? Any tips or tricks to share?
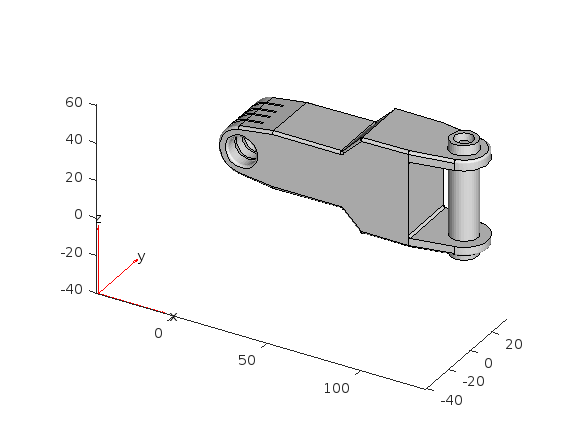
Something that had bothered me ever since I became an FEA analyst (2012) was the apparent inability of the "camera" in Matlab's 3D plot to function like the "cameras" in CAD/CAE packages.
For instance, load the ForearmLink.stl model that ships with the PDE Toolbox in Matlab and ParaView and try rotating the model.
Note that I cant seem to rotate continuously around the x-axis. It appears to only support rotations from [0, 360] as opposed to [-inf, inf]. So, for example, if I'm looking in the Y+ direction and rotate around X so that I'm looking at the Z- direction, and then want to look in the Y- direction, I can't simply keep rotating around the X axis... instead have to rotate 180 degrees around the Z axis and then around the X axis. I'm not aware of any data visualization applications (e.g., ParaView, VisIt, EnSight) or CAD/CAE tools with such an interaction.
Note that at the 50 second mark, I set a view in ParaView: looking in the [X-, Y-, Z-] direction with Y+ up. Try as I might in Matlab, I'm unable to achieve that same view perspective.
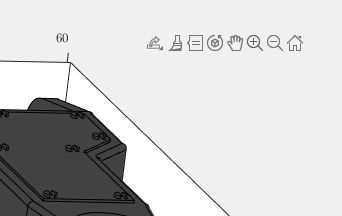
Today I discovered that if one turns on the Camera Toolbar from the View menubar, then clicks the Orbit Camera icon, then the No Principal Axis icon:
I've noticed is that the highly rated fonts for coding (e.g. Fira Code, Inconsolata, etc.) seem to overlook one issue that is key for coding in Matlab. While these fonts make 0 and O, as well as the 1 and l easily distinguishable, the brackets are not. Quite often the curly bracket looks similar to the curved bracket, which can lead to mistakes when coding or reviewing code.
So I was thinking: Could Mathworks put together a team to review good programming fonts, and come up with their own custom font designed specifically and optimized for Matlab syntax?
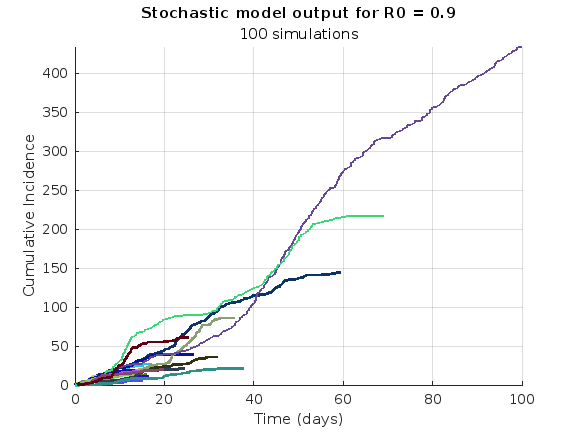
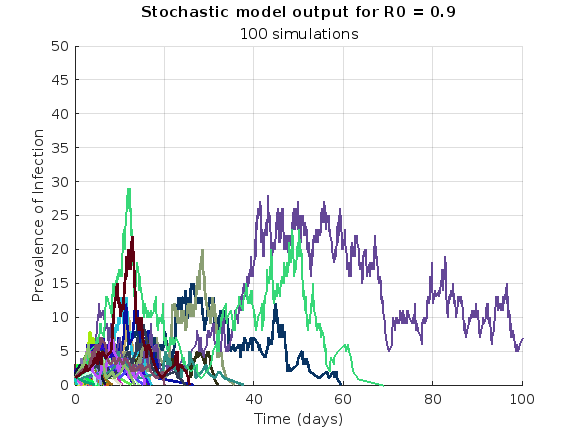
We are modeling the introduction of a novel pathogen into a completely susceptible population. In the cells below, I have provided you with the Matlab code for a simple stochastic SIR model, implemented using the "GillespieSSA" function
Suppose you need to do a computation many times. We are going to assume that this computation cannot be vectorized. The simplest case is to use a for loop:
number_of_elements = 1e6;
test_fcn = @(x) sqrt(x) / x;
tic
for i = 1:number_of_elements
x(i) = test_fcn(i);
end
t_forward = toc;
disp(t_forward + " seconds")
0.10925 seconds
Preallocation:
This can easily be sped up by preallocating the variable that houses results:
tic
x = zeros(number_of_elements, 1);
for i = 1:number_of_elements
x(i) = test_fcn(i);
end
t_forward_prealloc = toc;
disp(t_forward_prealloc + " seconds")
0.035106 seconds
In this example, preallocation speeds up the loop by a factor of about three to four (running in R2024a). Comment below if you get dramatically different results.
Is there a way to skip the explicit preallocation and still be fast? Indeed, there is.
clear x
tic
for i = number_of_elements:-1:1
x(i) = test_fcn(i);
end
t_backward = toc;
disp(t_backward + " seconds")
0.032392 seconds
By running the loop backwards, the preallocation is implicitly performed during the first iteration and the loop runs in about the same time (within statistical noise):
Do you get similar results when running this code? Let us know your thoughts in the comments below.
Beneficial side effect:
Have you ever had to use a for loop to delete elements from a vector? If so, keeping track of index offsets can be tricky, as deleting any element shifts all those that come after. By running the for loop in reverse, you don't need to worry about index offsets while deleting elements.
Spring is here in Natick and the tulips are blooming! While tulips appear only briefly here in Massachusetts, they provide a lot of bright and diverse colors and shapes. To celebrate this cheerful flower, here's some code to create your own tulip!
Joining us again is Eric Ludlam, development manager of MATLAB’s charting team. Discover more about Eric on our contributors bio page. Last time Eric was here, Daffodils were on his mind. Now, he focuses on tulips.
Spring is here in Natick and the tulips are blooming! While tulips appear only briefly here in Massachusetts, they provide a lot of bright and
One of the starter prompts is about rolling two six-sided dice and plot the results. As a hobby, I create my own board games. I was able to use the dice rolling prompt to show how a simple roll and move game would work. That was a great surprise!
Leaving feedback is a two-step process. At the bottom of most pages in the MATLAB documentation is a star rating.
Start by selecting a star that best answers the question. After selecting a star rating, an edit box appears where you can offer specific feedback.
When you press "Submit" you'll see the confirmation dialog below. You cannot go back and edit your content, although you can refresh the page to go through that process again.
Tips on leaving feedback
Be productive. The reader should clearly understand what action you'd like to see, what was unclear, what you think needs work, or what areas were really helpful.
Positive feedback is also helpful. By nature, feedback often focuses on suggestions for changes but it also helps to know what was clear and what worked well.
Point to specific areas of the page. This helps the reader to narrow the focus of the page to the area described by your feedback.
What happens to that feedback?
Before working at MathWorks I often left feedback on documentation pages but I never knew what happens after that. One day in 2021 I shared my speculation on the process:
> That feedback is received by MathWorks Gnomes which are never seen nor heard but visit the MathWorks documentation team at night while they are sleeping and whisper selected suggestions into their ears to manipulate their dreams. Occassionally this causes them to wake up with a Eureka moment that leads to changes in the documentation.
I'd like to let you in on the secret which is much less fanciful. Feedback left in the star rating and edit box are collected and periodically reviewed by the doc writers who look for trends on highly trafficked pages and finer grain feedback on less visited pages. Your feedback is important and often results in improvements.