Adam Danz
MathWorks
Software engineer at MathWorks with a Ph.D. in neurophysiology from the University of Rochester (NY). Specialized in visual and vestibular systems, multisensory integration, sensory-motor and control systems, steering, and navigation. Former member of the MathWorks Community Advisory Board. *My community contributions before 14-Feb-2022 were prior to my employment at MathWorks.
He/him
統計
コントリビューション
44 投稿
コントリビューション
0 パブリック チャネル
平均評価
コントリビューション
54 ハイライト
平均いいねの数
6


Feeds
公開済み
Developing a Mass Spring Damper App using MVC Architecture and Simulink
Guest Writers Ken Deeley Ken is an application engineer in Cambridge, UK, supporting MathWorks users with their...
14日 前

Can we make a Rain cloud plot in matlab?
Can we make a Rain cloud plot in matlab? Yes - as of R2026a, use the raincloudplot function. See the announcement on the Grap...
約2ヶ月 前 | 0
公開済み
raincloudplot: Cloudy With A Chance of Observations
Guest Writer: Baldvin Einarsson Baldvin is a software engineer in the Statistics and Machine Learning Toolbox. His...
約2ヶ月 前

公開済み
An Accessible & Modern Axes Toolbar
Guest Writer: Jessa Karlberg Jessa is a software engineer on the Graphics Interactions and Accessibility team at MathWorks....
3ヶ月 前

Discussion
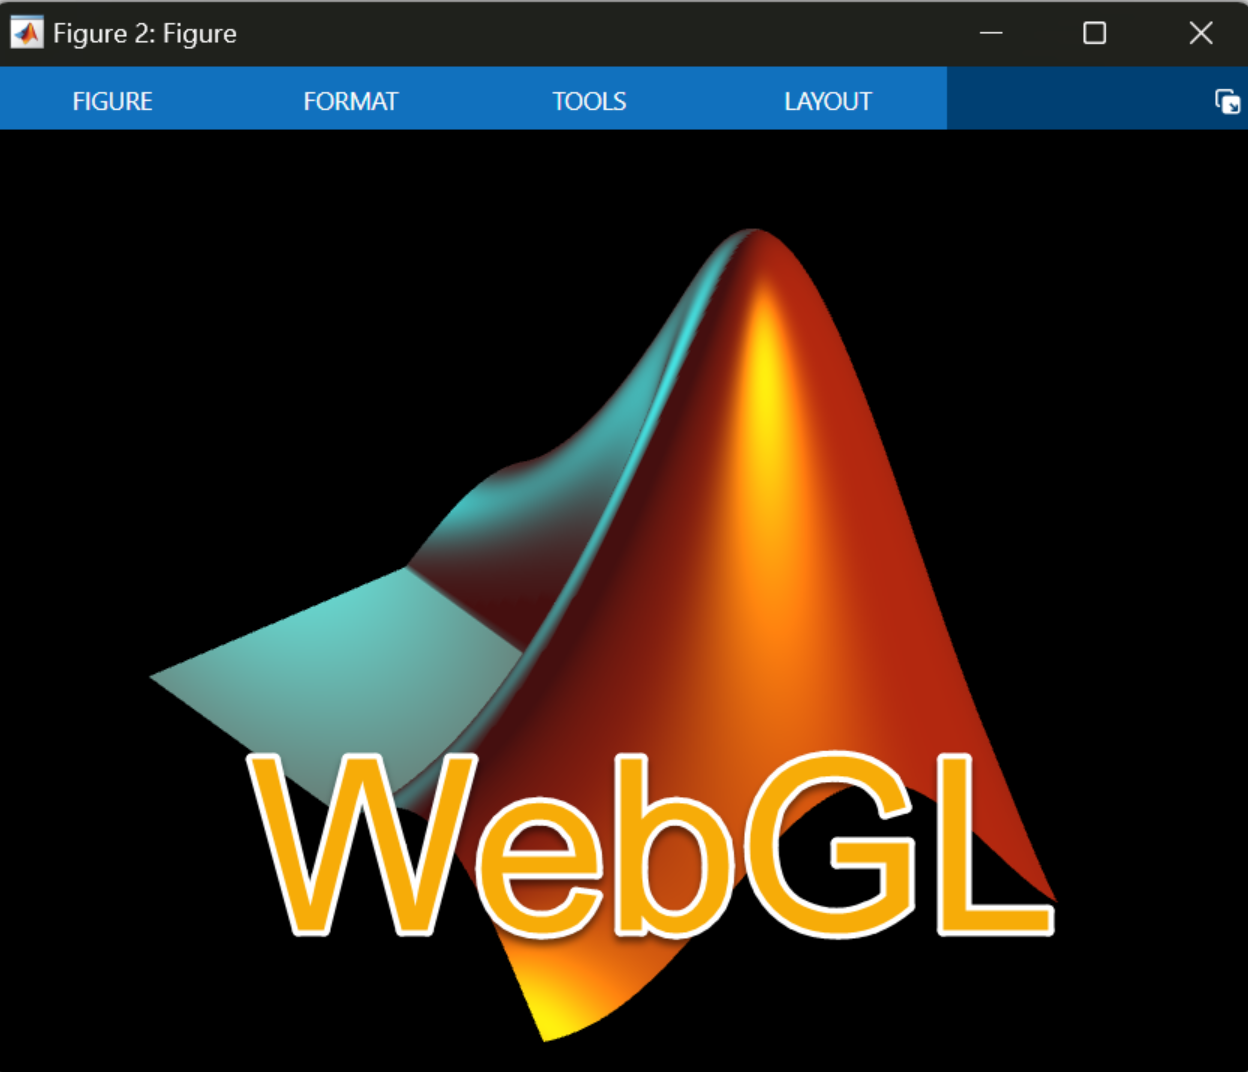
Check out the first interactive MATLAB figure on the web!
Starting in R2026a you can export MATLAB figures to an HTML file that preserves axes interactions. Click on the figure below ...
3ヶ月 前 | 0
公開済み
Graphics and App Building Updates in R2026a
The R2026a release is now available, and I’ve selected a few highlights to keep you up to date on the most important...
3ヶ月 前

UIAxes 3D scatter plot becomes simplified when rotating with the mouse (App Designer)
Your hunch is correct. In some conditions, the data in the visualization is subsampled to support smoother interactions. > I ...
4ヶ月 前 | 0
Is it possible to change color for the plot function in opticalFlow class?
The "Color" name-value-pair appeared in the documentation for the plot function in opticalFlow class starting in R2023a. http...
4ヶ月 前 | 0
公開済み
2025 Year In Review: Graphics and App Building
It was a big year for the MATLAB Graphics and App Building blog, from announcing a brand‑new WebGL‑based graphics system to...
6ヶ月 前
公開済み
Introducing New Interactions System in MATLAB R2025a
Guest Writer: Will Jackson Will Jackson serves as the manager of the interactions and accessibility team for MATLAB. Will...
6ヶ月 前

公開済み
A Bow made of Ribbon
Guest Writer: Eric Ludlam Eric Ludlam is the development manager of MATLAB’s Charting team. Eric has a whopping...
7ヶ月 前

Discussion
New Feature in MATLAB R2025a: control the size and layout of exported graphics
Our exportgraphics and copygraphics functions now offer direct and intuitive control over the size, padding, and aspect ratio of...
8ヶ月 前 | 0
How to save a figure that is larger then the screen?
Starting in R2025a, exportgraphics has options to specify the size of the exported figure. These features are exported in detai...
8ヶ月 前 | 0
公開済み
Advanced Control of Size and Layout of Exported Graphics
Guest Writer: Leia Rich Leia is a software engineer on the MATLAB Charting Team. She first joined MathWorks as...
8ヶ月 前

Discussion
Sparklines and interactive data exploration
It’s exciting to dive into a new dataset full of unfamiliar variables but it can also be overwhelming if you’re not sure where...
9ヶ月 前 | 0
公開済み
Data Exploration Using Sparklines and Summary Statistics in Live Scripts
Did you know you can explore visualizations and basic statistics of tabular data directly within a live script without...
9ヶ月 前

Exporting an app to PDF from standalone app
I see you are using R2025a -- thanks for including that info on the right. Be on the lookout for Update #2, available soon. ...
9ヶ月 前 | 0
公開済み
WebGL: MATLAB’s New Graphics Rendering System
Guest Writer: Maddie Moon Maddie first worked with the Graphics and App Building team during her Engineering...
9ヶ月 前

Turn off UIFigure visibility during unit test
Interaction tests using press, drag, etc, require figure visibility to be on in the App Testing Framework. Make sure you're n...
10ヶ月 前 | 0
| 採用済み
Discussion
Polar axes now support patches and surfaces (R2025a)
Check out how these charts were made with polar axes in the Graphics and App Building blog's latest article "Polar plots with ...
10ヶ月 前 | 0
how can I make a colored 2D-surface in a polar plot? I want to give some labels to this polar... It is possible?
Starting in R2025a, polar axes support patch and surface objects. Here's @Joseph Cheng's example applied to polar axes. Ther...
10ヶ月 前 | 0
How can I fill with color a odd flower in a cartesian o polar coordinates?
Starting in R2025a, polar axes support patch and surface objects. Here's @bio lim's example applied to polar axes. There's m...
10ヶ月 前 | 0
公開済み
Polar plots with patches and surfaces – R2025a
Guest Writer: Grant Marshall Grant is a software engineer on the MATLAB Graphics & Charting Team. He first joined...
10ヶ月 前

公開済み
Goodbye GUIDE, Hello App Designer: Evolving Your MATLAB Apps
Guest Writer: Sonia Sethi Sonia is a product marketer with the MATLAB Outbound Team, focused on developing technical...
10ヶ月 前

Discussion
How to modernized figure-based apps with UI Components
In the latest Graphics and App Building blog article, documentation writer Jasmine Poppick modernized a figure-based bridge anal...
11ヶ月 前 | 2
公開済み
Bridging the Gap in App Building: From uicontrol to UI Components
Guest Writer: Jasmine PoppickJasmine works in documentation at MathWorks, both as a writer for the App Building area and as...
11ヶ月 前

公開済み
Creating a Flight Tracking Dashboard, Part 3: Using Modular Application Development Principles to Assemble the Dashboard
Are you ready to take your app building skills to the next level? This article walks through an advanced workflow for...
12ヶ月 前
Discussion
A guide to themes for chart creators and app builders
This week's Graphics and App Building blog article guides chart authors and app builders through the process of designing for a ...
約1年 前 | 1
公開済み
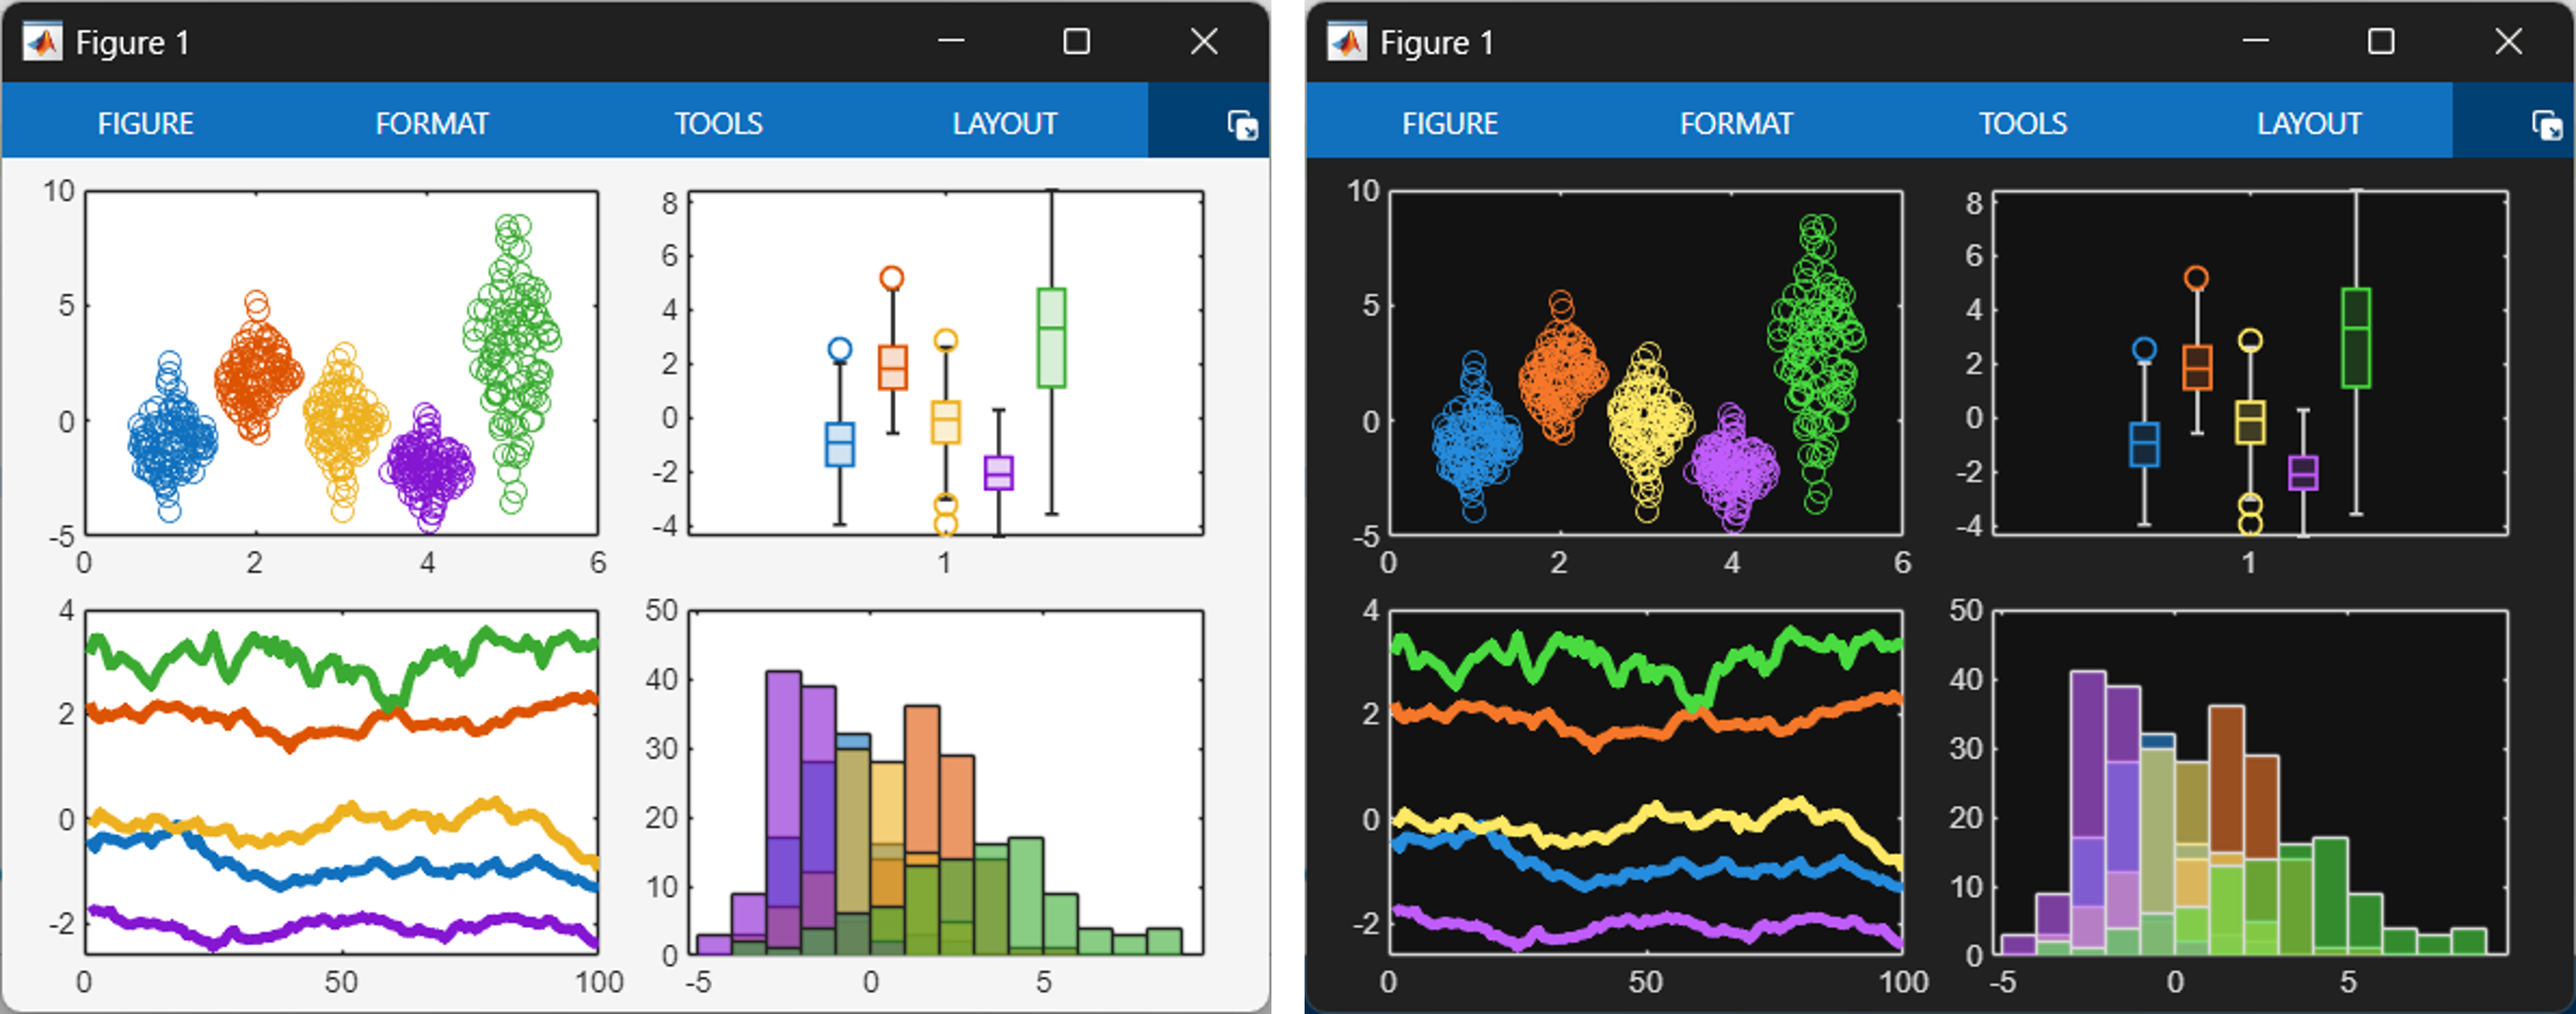
A Guide to Themes for Chart Creators and App Builders
The long-awaited dark theme is now available in MATLAB R2025a. This article serves as a guide for designing charts and apps...
約1年 前
Is there such a thing as MATLAB Markdown
In addition to recommendations to use a Live Script, starting in R2025a the MATLAB editor supports Markdown notation in addition...
約1年 前 | 2