Latest Contributions
We've all been there. You've got some kind of output that displays perfectly in the command window and you just want to capture that display as a string so you can use it again somewhere else. Maybe it's a multidimensional array, a table, a structure, or a fit object that perfectly displays the information you need in a neat and tidy format but when you try to recreate the display in a string variable it's like reconstructing the Taj Mahal out of legos.
Enter Matlab r2021a > formattedDisplayText()
Use str=formattedDisplayText(var) the same way you use disp(var) except instead of displaying the output, it's stored as a string as it would appear in the command window.
Additional name-value pairs allow you to
- Specify a numeric format
- Specify loose|compact line spacing
- Display true|false instead of 1|0 for logical values
- Include or suppress markup formatting that may appear in the display such as the bold headers in tables.
Demo: Record the input table and results of a polynomial curve fit
load census
[fitobj, gof] = fit(cdate, pop, 'poly3', 'normalize', 'on')
Results printed to the command window:
fitobj =
     Linear model Poly3:
     fitobj(x) = p1*x^3 + p2*x^2 + p3*x + p4
       where x is normalized by mean 1890 and std 62.05
     Coefficients (with 95% confidence bounds):
       p1 =       0.921  (-0.9743, 2.816)
       p2 =       25.18  (23.57, 26.79)
       p3 =       73.86  (70.33, 77.39)
       p4 =       61.74  (59.69, 63.8)
gof =
  struct with fields:
             sse: 149.77
         rsquare: 0.99879
             dfe: 17
      adjrsquare: 0.99857
            rmse: 2.9682
Capture the input table, the printed fit object, and goodness-of-fit structure as strings:
rawDataStr = formattedDisplayText(table(cdate,pop),'SuppressMarkup',true)
fitStr = formattedDisplayText(fitobj)
gofStr = formattedDisplayText(gof)
Display the strings:
rawDataStr =
    "    cdate     pop
         _____    _____
         1790       3.9
         1800       5.3
         1810       7.2
         1820       9.6
         1830      12.9
         1840      17.1
         1850      23.1
         1860      31.4
         1870      38.6
         1880      50.2
         1890      62.9
         1900        76
         1910        92
         1920     105.7
         1930     122.8
         1940     131.7
         1950     150.7
         1960       179
         1970       205
         1980     226.5
         1990     248.7
     "
fitStr =
    "     Linear model Poly3:
          ary(x) = p1*x^3 + p2*x^2 + p3*x + p4
            where x is normalized by mean 1890 and std 62.05
          Coefficients (with 95% confidence bounds):
            p1 =       0.921  (-0.9743, 2.816)
            p2 =       25.18  (23.57, 26.79)
            p3 =       73.86  (70.33, 77.39)
            p4 =       61.74  (59.69, 63.8)
     "
gofStr =
    "           sse: 149.77
            rsquare: 0.99879
                dfe: 17
         adjrsquare: 0.99857
               rmse: 2.9682
     "
Combine the strings into a single string and write it to a text file in your temp directory:
txt =  strjoin([rawDataStr; fitStr; gofStr],[newline newline]);
file = fullfile(tempdir,'results.txt');
fid = fopen(file,'w+');
cleanup = onCleanup(@()fclose(fid));
fprintf(fid, '%s', txt);
clear cleanup
Open results.txt.
winopen(file) % for Windows platforms

New to r2020a, leapseconds() creates a table showing all leap seconds recognized by the datetime data type.
>> leapseconds()
ans =
  27×2 timetable
       Date        Type    CumulativeAdjustment
    ___________    ____    ____________________
    30-Jun-1972     +              1 sec
    31-Dec-1972     +              2 sec
    31-Dec-1973     +              3 sec
    31-Dec-1974     +              4 sec
    31-Dec-1975     +              5 sec
             << 21 rows removed >>
    31-Dec-2016     +             27 sec
Leap seconds can covertly sneak into your data and cause errors that are difficult to resolve if the leap seconds go undetected. A leap second was responsible for crashing Reddit , Mozilla, Yelp, LinkedIn and other sites in 2012.
Detect leap seconds present in a vector of years
% Define a vector of years
t = 2005:2008;
allLeapSeconds = leapseconds();
isYearWithLeapSecond = ismember(t,year(allLeapSeconds.Date));
% Show years that contain a leap second
t(isYearWithLeapSecond)
ans =
        2005        2008
Detect leap seconds present in a vector of months
% Define a vector of months
t = datetime(1972, 1, 1) + calmonths(0:11);
t.Format = 'MMM-yyyy';
allLeapSeconds = leapseconds();
[tY,tM] = ymd(t);
[leapSecY, leapSecM] = ymd(allLeapSeconds.Date);
isMonthWithLeapSecond = ismember([tY(:),tM(:)], [leapSecY, leapSecM], 'rows');
% Show months that contain a leap second
t(isMonthWithLeapSecond)
ans =
  1×2 datetime array
   Jun-1972   Dec-1972
List all leap seconds in your lifetime
% Enter your birthday in mm/dd/yyyy hh:mm:ss format
yourBirthday = '01/15/1988 14:30:00';
yourTimeRange = timerange(datetime(yourBirthday), datetime('now'));
allLeapSeconds = leapseconds();
lifeLeapSeconds = allLeapSeconds(yourTimeRange,:);
lifeLeapSeconds.YourAge = lifeLeapSeconds.Date - datetime(yourBirthday);
lifeLeapSeconds.YourAge.Format = 'y';
% Show table
fprintf('\n Leap seconds in your lifetime:\n')
disp(lifeLeapSeconds)
Leap seconds in your lifetime:
       Date        Type    CumulativeAdjustment     YourAge
    ___________    ____    ____________________    __________
    31-Dec-1989     +             15 sec           1.9587 yrs
    31-Dec-1990     +             16 sec            2.958 yrs
                        << 8 rows removed >>
    30-Jun-2012     +             25 sec           24.456 yrs
    30-Jun-2015     +             26 sec           27.454 yrs
    31-Dec-2016     +             27 sec            28.96 yrs
What is a leap second?
A second is defined as the time it takes a cesium-133 atom to oscillate 9,192,631,770 times under controlled conditions. The transition frequency is so precise that it takes 100 million years to gain 1 second of error [1]. If the earth’s rotation were perfectly synchronized to the atomic second, a day would be 86,400 seconds. But the earth’s rate of rotation is affected by climate, winds, atmospheric pressure, and the rate of rotation is gradually decreasing due to tidal friction [2,3]. Several months before the expected difference between the atomic clock-based time (UTC) and universal time (UT1) reaches +/- 0.9 seconds the IERS authorizes the addition (or subtraction) of 1 leap second (see plot below). Since the first leap second in 1972, all leap second adjustments have been made on the last day of June or December and all adjustments have been +1 second which explains the + signs in the type column of the leapseconds() table.
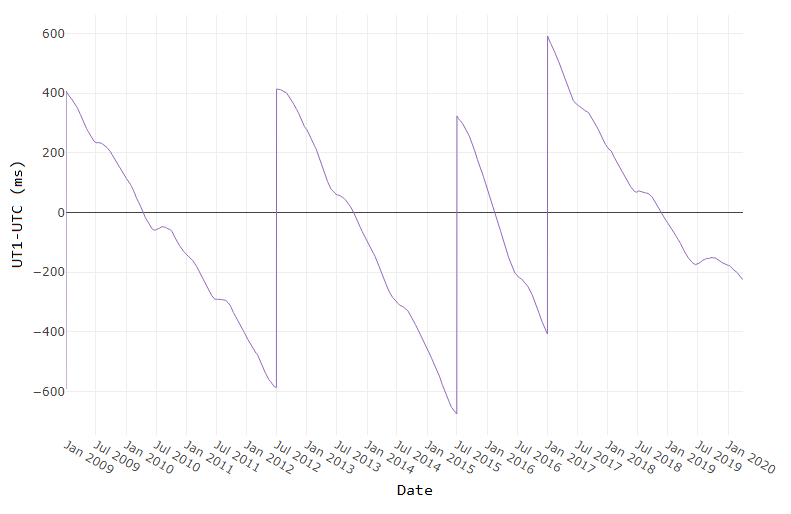
[ Image source ]
How to reference the leap second schedule in your code
Since leap second adjustments are not regularly timed, you can record the official IERS Bulletin C version used at the time of your analysis by accessing the 2nd output to leapseconds().
[T,vers] = leapseconds
What do leap seconds look like in datetime values?
A minute typically has 60 seconds spanning from 0:59. A minute containing a leap second has 61 seconds spanning from 0:60.
December 30, 2016 was a normal day. If we add the usual 86400 seconds to the start of that day, the result is the start of the next day.
d = datetime(2016, 12, 30, 'TimeZone','UTCLeapSeconds') + seconds(86400)
d =
  datetime
   2016-12-31T00:00:00.000Z
The next day, December 31, 2016, had a leap second. If we add 86400 seconds to the start of that day, the result is not the start of the next day.
d = datetime(2016, 12, 31, 'TimeZone','UTCLeapSeconds') + seconds(86400)
d =
  datetime
   2016-12-31T23:59:60.000Z
When will the next leap second be?
As of the current date (April 2020) the timing of the next leap second is unknown. Based on the data from the plot above, what's your guess?
References


- Change an answer to a comment
- Change an answer with comments to a group of comments
- Change a comment to an answer
- Move a comment

- Replace the legend with a colorbar to update the location and orientation of the colorbar.
- Define a GridSizeChangedFcn within the loop so that it is called every time a tile is added.
- Create a figure with many tiles (~20) and dynamically set a color to each row of axes.
- Assign xlabels only to the bottom row of tiles and ylabels to only the left column of tiles.
- What happens when all elements of v are equal?
- Can you produce a vector with uniform spacing without using colons or linspace?
- What additional steps would be needed to use isuniform with circular data?
- isuniform - documentation
- Floating point numbers - documentation
- Floating point numbers - Cleve's Corner (blog)
Starting in MATLAB R2021a axis tick labels will auto-rotate to avoid overlap when the user manually specifies ticks or tick labels ( release notes ). In custom visualization functions, the tick label density or tick label lengths may be variable and unknown. The new auto-rotation feature removes the burden of detecting the need to rotate manually-set labels and eliminates the need to manually rotate them.
Many properties and combinations of properties can cause tick labels to overlap if they are not rotated.
- Length of tick labels
- Number of tick labels
- Interval between tick labels
- Font size
- Font name
- Figure size
- Axes size
- Viewing angle of the axes
Demo: varying tick density and length of tick labels
These 9 axes vary by the number of x-ticks and length of x-tick-labels. MATLAB auto-rotates the labels when needed.
Demo: Changes to axis view angle and rotation
The auto-rotation feature updates the label angles as the axes change programmatically or during user interaction.
What if I don't want auto-rotation?
Auto-rotation mode is on by default for each X|Y|Z axis. When the tick label rotation angle is manually set from the X|Y|ZTickLabelRotation property of axes or by using xtickangle | ytickangle | ztickangle , auto-rotation is turned off. Auto-rotation can also be turned off by setting the X|Y|ZTickLabelRotationMode axis property to manual but it's important to also hold the axis properties so that the rotation mode does not revert to the default value, auto. If you're looking for a broader method of reverting to older behavior you can set the default label rotation mode to manual at the start of a function that produces multiple plots and then revert to the factory default rotation mode at the end of the file (consider using onCleanup).
set(groot,'defaultAxesXTickLabelRotationMode','manual')
set(groot,'defaultAxesYTickLabelRotationMode','manual')
set(groot,'defaultAxesZTickLabelRotationMode','manual')
% Revert to factory-default
set(groot,'defaultAxesXTickLabelRotationMode','remove')
set(groot,'defaultAxesYTickLabelRotationMode','remove')
set(groot,'defaultAxesZTickLabelRotationMode','remove')
A copy of this Community Highlight is attached as a live script.
Highlights について
View announcements and updates in the MATLAB and Simulink product community, including MATLAB Central and Discussions.Share your feedback and join the conversation by participating in polls posted by staff and community power users. These polls appear across MathWorks.com, so look for them while signed in to community pages.