Introduction to 5G NR Signal Detection
This example shows how to implement PSS detection and SSB grid recovery for HDL code generation.
Introduction
This example introduces 5G NR signal detection, and a workflow for developing a design for HDL code generation. It uses a simplified version of the algorithm implemented in the NR HDL Cell Search reference application. The NR HDL Cell Search reference application is highly configurable and extensible, resulting in a complex design. This example focuses on the core concepts of the signal detection algorithm by reducing the complexity and flexibility of the design, in order to introduce the workflow used to develop an HDL implementation.
5G downlink signals contain a synchronization signal block (SSB), also referred to as the synchronization signal / physical broadcast channel (SS/PBCH block), which can be used by a receiver to synchronize to the signal, and to decode some parameters of the cell. An SSB consists of the primary and secondary synchronization signals (PSS and SSS), and the physical broadcast channel (PBCH) with its demodulation reference signals (DMRS). The PSS and SSS sequence numbers are used to calculate the cell identification number, and the PBCH carries the master information block (MIB). For frequency range 1 (FR1, carrier frequencies < 6 GHz) the SSB uses a subcarrier spacing (SCS) of either 15 or 30 kHz. More information on the contents of the SSB can be found in the tutorial Synchronization Signal Blocks and Bursts (5G Toolbox).
This example uses the PSS for signal detection and timing synchronization and the SSB is OFDM demodulated using the timing information from the PSS. The SSS and PBCH are decoded from the OFDM demodulated data to verify the data recovered by the signal detection and demodulation algorithm.
Example Structure
The signal detection and demodulation algorithm is implemented in both floating point MATLAB code and a fixed-point Simulink model. Developing the first version of the design in MATLAB allows for a focus on the high-level algorithm without including the additional complexity of hardware implementation details. Once the MATLAB reference algorithm is proven to work this is used as the basis for a Simulink model that supports HDL code generation. The MATLAB reference can be used to verify the output of the Simulink model.
The Simulink model supports HDL code generation and includes hardware implementation details such as fixed-point data types, control signals, buffering, delay balancing and serialization for reducing resource use. The output from the Simulink model matches the output from the MATLAB reference code, with some small quantization error on the data signals due to the fixed-point data types used in the Simulink model.
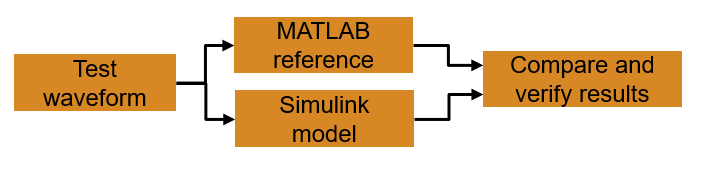
When you run this example, the script generates a basic 5G test waveform and defines variables used by the signal detection and demodulation algorithm. The MATLAB reference code performs signal detection and SSB demodulation, and then the script simulates the Simulink model to perform the same operations on the test waveform. The outputs from the MATLAB reference and the Simulink model are compared to verify the behavior. The MIB message is decoded from the SSB grid recovered by the Simulink model to confirm the SSB grid data is correct.
Signal Detection and Demodulation Algorithm Overview
The PSS in the received signal is detected using three correlators, one for each of the three possible PSS sequences defined by the 5G standard, TS 38.211 Section 7.4.2.2 [1]. A strong correlation between the received signal and one of the expected PSS sequences indicates that a signal has been detected. The signal power is measured over the correlation length, and is used to calculate a threshold for the correlation output. A signal is detected when one of the correlator outputs exceeds the threshold. The scaling factor is used to set the sensitivity of the detector and help to avoid false positive detections. A minimum threshold value is also defined to prevent noise triggering the detector where no signal is present.

The PSS detector selects the first occasion that the output of any of the three PSS correlators exceeds the threshold. The index of the PSS correlator that exceeded the threshold gives nCellID2 for the cell. nCellID2 is part of the physical layer cell identity, used to determine the cell ID. The location of the correlation peak is used to determine the timing of the start of the SSB. The SSB timing information is used to OFDM demodulate the SSB resource grid. This resource grid contains the PSS, SSS, PBCH and BCH-DMRS. The information contained in the grid can be verified by decoding the MIB information using 5G Toolbox™ functions.
The detector requires an input sampling rate of 7.68 MSPS. It supports FR1 SSB configurations, and OFDM demodulates the SSB from the first PSS that exceeds the threshold. For 30 kHz SSB subcarrier spacing the PSS correlator uses the 7.68 MSPS input signal. For the 15 kHz SSB subcarrier spacing a halfband decimator is used to downsample the signal to 3.84 MSPS. The recovered SSB grid consists of 4 OFDM symbols, each with 240 subcarriers.
Set Up Test Waveform and Workspace Variables
Generate a test waveform from wavegen.m using an SSB subcarrier spacing of 30 kHz and SNR of 50 dB. The wavegen function generates a basic 5G waveform using the nrWaveformGenerator from 5G Toolbox. For more information on generating 5G waveforms, refer to the 5G NR Downlink Vector Waveform Generation (5G Toolbox) example. The waveform is a FR1, 5 subframes in duration, with SSB pattern Case C and a subcarrier spacing of 30 kHz. You can change the scsSSB variable to 15 to generate a waveform with 15 kHz subcarrier spacing and SSB pattern Case A. You can use the SNR variable can be used to control the amount of noise that is added to the waveform. After the noise is added the signal is normalized to have a maximum absolute value of 0.95 to maximize the use of the dynamic range of the fixed point data types used in the Simulink implementation, and to maintain the signal scaling between MATLAB and Simulink.
scsSSB = 30;    % kHz
SNR = 50;       % dB

[rxWaveform, info] = wavegen(scsSSB, SNR);
Fs_rxWaveform = info.ResourceGrids.Info.SampleRate;
Plot the spectrogram of rxWaveform.
figure;
spectrogram(rxWaveform(:,1),ones(512,1),0,512,'centered',Fs_rxWaveform,'yaxis','MinThreshold',-130);
title('Signal Spectrogram');

Resample the signal to 7.68e6, which is the sampling rate required at the input to the detector.
Fs_in = 7.68e6;
signalIn = resample(rxWaveform,Fs_in,Fs_rxWaveform);

Define constants for detector implementation. To accommodate the 240 subcarriers occupied by the SSB, the FFT size is set to 256. Multiplying 256 by the subcarrier spacing gives the sampling rates required for the 15 kHz and 30 kHz subcarrier spacing cases.
Nfft  = 256;     % FFT size (SSB occupies 240 subcarriers)
Fs_30 = 7.68e6;  % Sampling frequency for 30 kHz subcarrier spacing (=Fs_in)
Fs_15 = 3.84e6;  % Sampling frequency for 15 kHz subcarrier spacing
Get correlation filter coefficients for the 3 PSS sequences.
pssCorrelationCoeffs = getCorrelationCoeffs(Nfft);
Design the halfband filter for reducing the sample rate from 7.68 MHz to 3.84 MHz.
Fc_15 = 120 * 15e3;
scs15halfband = dsp.FIRHalfbandDecimator(...
    'Specification',       'Transition width and stopband attenuation', ...
    'TransitionWidth',     Fs_15 - 2*Fc_15, ...
    'StopbandAttenuation', 60, ...
    'SampleRate',          Fs_in);
halfband_grpDelay = grpdelay(scs15halfband,2);
halfband_transient = ceil(halfband_grpDelay(2)/2);
MATLAB Reference Implementation of Signal Detection and Demodulation
Run the MATLAB implementation of the signal detection and demodulation algorithm and display the locations of the PSS peaks located in the waveform.
fprintf('Running MATLAB signal detection and demodulation code\n');
Running MATLAB signal detection and demodulation code
Apply the halfband filter if the subcarrier spacing of the SSB is 15 kHz, to reduce the sampling rate from 7.68 MSPS (Fs_30) to 3.84 MSPS (Fs_15). For 30 kHz subcarrier spacing, the halfband filter is not required as the sample rate of the input signal (Fs_in) matches the sample rate required to process the signal (Fs_30). This functionality is implemented by the nrhdlSignalDetection/SSB Detect and Demod/scsSelection subsystem in the Simulink model.
if scsSSB == 15
    Fs_correlator = Fs_15;
    halfbandOut = scs15halfband(signalIn);
    correlatorIn = halfbandOut(halfband_transient:end);
else
    Fs_correlator = Fs_30;      % Fs_30 == Fs_in
    correlatorIn = signalIn;
end
Correlate signal with all 3 PSS sequences. Each of the PSS sequences is Nfft coefficients in length. This functionality is implemented by the blocks PSS Correlator 0, PSS Correlator 1 and PSS Correlator 2 in the nrhdlSignalDetection/SSB Detect and Demod/PSS Detector subsystem.
psscorr      = zeros(length(correlatorIn),3);
psscorr(:,1) = filter(pssCorrelationCoeffs(:,1),1,correlatorIn);
psscorr(:,2) = filter(pssCorrelationCoeffs(:,2),1,correlatorIn);
psscorr(:,3) = filter(pssCorrelationCoeffs(:,3),1,correlatorIn);
Calculate the magnitude squared of each of the PSS correlator outputs. This functionality is implemented by the blocks xCorrMag0, xCorrMag1 and xCorrMag2 in the nrhdlSignalDetection/SSB Detect and Demod/PSS Detector subsystem.
psscorr_mag_sq = abs(psscorr).^2;
Calculate signal energy at the PSS correlators using a moving average filter. PSS correlations are calculated over Nfft samples, so the signal energy is measured over the same window. This calculation is implemented by the blocks signalMag and signalMagAverage in the nrhdlSignalDetection/SSB Detect and Demod/PSS Detector subsystem.
energyFilt  = ones(Nfft,1);
sig_mag_sq  = abs(correlatorIn).^2;
sigEnergy   = filter(energyFilt,1,sig_mag_sq);

% Calculate threshold for correlation values from signal energy.
minimumThreshold  = Nfft*(2^-12)^2;          % Set minimumThreshold to avoid triggering on noise
PSSThreshold_dB  = -6;                       % Strength threshold in dBs (0 is least sensitive).
thresholdScaling = 10^(PSSThreshold_dB/10);  % Threshold scaling factor
threshold = sigEnergy.*thresholdScaling;     % Calculate the threshold using the signal power and threshold scaling factor
threshold(threshold<minimumThreshold) = minimumThreshold; % Apply minimum threshold value where calculated threshold is lower than the minimum

% Plot correlator outputs and threshold
figure;
plot(psscorr_mag_sq,'.-');
hold on;
plot(threshold);
legend('PSS 0','PSS 1','PSS 2','Threshold');
title('MATLAB correlator outputs and threshold');

Find correlation values that exceed the threshold, and pick maximum value within window_length samples of each peak to ensure local maximum is selected. This is implemented in the nrhdlSignalDetection/SSB Detect and Demod/PSS Detector/Find Peak subsystem in the Simulink model.
window_length=11;
[locations_1] = peakPicker(psscorr_mag_sq(:,1),threshold,window_length);
[locations_2] = peakPicker(psscorr_mag_sq(:,2),threshold,window_length);
[locations_3] = peakPicker(psscorr_mag_sq(:,3),threshold,window_length);
Combine all of the locations into a single vector and check that some peaks were found.
ml_locations = [locations_1 locations_2 locations_3];

% Stop processing if no peaks are found
if isempty(ml_locations)
    fprintf('No correlation values found that exceed the threshold\n');
    return;
end
Select the first correlation peak found. The PSS sequence number of the filter producing the peak gives nCellID2 for the signal. This function is performed by nrhdlSignalDetection/SSB Detect and Demod/PSS Detector/Find Peak/register PSS ID in the Simulink model.
selectedPeak = min(ml_locations);
[~,pssCorrNumber] = max(psscorr(selectedPeak,:));
ml_nCellID2 = pssCorrNumber-1;
Extract the SSB region from the signal for OFDM demodulation by calculating the sample offset from the PSS peak to the start of the SSB. The correlation peak occurs at the end of the OFDM symbol containing the PSS. A sample offset, equal to FFT length plus the cyclic prefix length, is subtracted from the PSS peak location to find the start of OFDM symbol carrying the PSS. The cyclic prefix length for the SSB OFDM symbols is 18 samples. This functionality is implemented by the delay to symbol start and OFDM Demod Controller blocks in the nrhdlSignalDetection/SSB Detect and Demod/OFDM Demodulator subsystem.
pssSymbolStart = selectedPeak-(Nfft+18-1); % Jump back to start of OFDM symbol containing PSS (FFT length + cyclic prefix length)

% If a PSS signal is detected within NFFT+18 samples of the start of the
% signal, this means that the start of the SSB is missing from the waveform
% therefore it cannot be demodulated.
if pssSymbolStart<1
    fprintf('The detected PSS peak is from a partial SSB at the start of the signal. The start of the SSB is missing from waveform, and the SSB cannot be demodulated.\n');
    return;
end

nrDemodSymbolEnd = pssSymbolStart + 4*(Nfft+18); % SSB is 4 OFDM symbols long
ssbOFDMInput = correlatorIn(pssSymbolStart:nrDemodSymbolEnd-1);
The nrOFDMDemodulate function requires input data starting at a slot boundary, which is one OFDM symbol before the start of the SSB. The first OFDM symbol in the slot has a different cyclic prefix length of either 20 for SSB subcarrier spacing of 15 kHz, or 22 for SSB subcarrier spacing of 30 kHz. The input signal to the nrOFDMDemodulate is padded with zeros equal to the size of this OFDM symbol to account for the extra OFDM symbol required. The additional OFDM symbol output from the nrOFDMDemodulate function is discarded later. The zero padding step is not required in the Simulink implementation as the OFDM Demodulator block does not have the requirement to start on a slot boundary.
if scsSSB == 15
    slotFirstCyclicPrefix = 20;
else
    slotFirstCyclicPrefix = 22;
end
nrDemodSymbolPad = zeros(Nfft+slotFirstCyclicPrefix,1);
nrDemodSignalIn = [nrDemodSymbolPad; ssbOFDMInput];
OFDM Demodulate the SSB. In the Simulink model this functionality is performed by the OFDM Demodulator block in the subsystem nrhdlSignalDetection/SSB Detect and Demod/OFDM Demodulator.
carrier = nrCarrierConfig('SubcarrierSpacing',scsSSB,'NSizeGrid',20);
grid = nrOFDMDemodulate(carrier,nrDemodSignalIn,'SampleRate',Fs_correlator,'Nfft',256);
Discard the first OFDM symbol to get the SSB from the grid, as the output from nrOFDMDemodulate starts at a slot boundary, one OFDM symbol before the SSB. The ml_SSBGrid signal is equivalent to output from the OFDM Demodulator in the Simulink model, sl_SSBGrid.
ml_SSBGrid = grid(:,2:5);
Get the IQ samples that cover the SSB region, prior to OFDM demodulation. This is equivalent to the input to the OFDM Demodulator in the Simulink model, sl_SSBRawIQ.
ml_SSBRawIQ = nrDemodSignalIn(Nfft+slotFirstCyclicPrefix+1:end);

fprintf('MATLAB signal detection and demodulation complete\n');
MATLAB signal detection and demodulation complete
Display MATLAB peak locations and nCellID2.
fprintf('MATLAB Peak Location(s) \n');
fprintf('    %i \n',ml_locations);

fprintf('MATLAB nCellID2 = %i\n', ml_nCellID2);
MATLAB Peak Location(s)
    826
    2470
    4666
    6310
    8506
    10150
    12346
    13990
MATLAB nCellID2 = 2
Simulink Model of Signal Detection and Demodulation
The Simulink model implements the signal detection and demodulation algorithm using a hardware modeling style and uses blocks that support HDL code generation. It uses fixed-point arithmetic and includes control signals to control the flow of data through the model. The Simulink model also uses a clock rate that is higher than the sample rate of the input signal, which makes it possible to share resources within the correlation filters to reduce the resource requirements of the design. The variable sl_in.cyclesPerSample is used to set the number of clock cycles per input sample. With this variable set to 8, the clock rate used in the model is 61.44 MHz, which is 8x larger than the input sampling rate Fs_in (7.68 MHz). To implement this in the Simulink model the input signal, sl_in.signalIn, has seven zeros inserted between each data sample and an input valid signal, sl_in.validIn, is created to indicate which of the input signal samples contains a valid data sample.
The input data signal is converted to a 16 bit signed fixed-point value, with 15 fractional bits. A boolean value is used to specify the subcarrier spacing for the SSB, with the value 0 representing 15 kHz, and 1 representing 30 kHz. The demodulated SSB grid output is a 24 bit signed fixed-point value with 15 fractional bits. The PSS ID output is an unsigned 2 bit integer number.
fprintf('Opening Simulink model\n');
open_system('nrhdlSignalDetection');
Opening Simulink model

There are 4 subsystems inside the SSB Detect and Demod subsystem, as shown in the diagram. The scsSelection subsystem performs a halfband decimation on the input signal and uses the scsSSB input to select between the 7.68 MSPS signal at the input for 30 kHz SCS and the 3.84 MSPS signal from the halfband decimator for 15 kHz SCS. The output from the scsSelection subsystem is equivalent to the correlatorIn signal in the MATLAB code. The PSS Detector subsystem implements the PSS correlation filters and threshold calculation, generating a strobe, strobeOut, a valid signal, strobeValid, and outputting the pssID when a PSS signal exceeds the threshold. The Stream Synchronizer subsystem uses a RAM FIFO to balance the delays introduced by the PSS Detector. The OFDM Demodulator subsystem generates the control signals for the OFDM demodulation from the first pssDetected strobe and performs OFDM demodulation.
open_system('nrhdlSignalDetection/SSB Detect and Demod','window');

close_system('nrhdlSignalDetection/SSB Detect and Demod');
Initialize constants required by Simulink model.
sl_in.scsSSB = isequal(scsSSB,30); % Convert scsSSB to boolean 0=15kHz, 1=30kHz
sl_in.Nfft = Nfft;
sl_in.thresholdScaling = fi(thresholdScaling,0,16,16);
sl_in.minimumThreshold = fi(minimumThreshold,0,16,20);
sl_in.halfbandCoeffs = [0 scs15halfband.coeffs.Numerator];
sl_in.halfbandTransient = halfband_transient-1;
sl_in.pssCorrelationCoeffs = pssCorrelationCoeffs;
sl_in.windowLength = window_length;
Set the simulation duration to 4 ms. The spectrogram of the input waveform shows all of the SSB data in the first 4 ms of the signal.
sl_in.stopTime = 4e-3;
Set the number of clock cycles per input data sample.
sl_in.cyclesPerSample = 8;
Set the Simulink sample time based on Fs_in and sl_in.cyclesPerSample to allow for resource sharing.
sl_in.sampleTime = 1/(Fs_in*sl_in.cyclesPerSample);
Set input data valid high for 1 in every sl_in.cyclesPerSample, and pad input data signal with zeros.
sl_in.signalIn = upsample(signalIn,sl_in.cyclesPerSample);
sl_in.validIn = upsample(ones(1,length(signalIn)),sl_in.cyclesPerSample);
sl_in.startIn = [1 zeros(1,length(sl_in.signalIn))];
Run Simulink model.
fprintf('Starting Simulink simulation\n');
sl_out = sim('nrhdlSignalDetection');
fprintf('Simulink simulation finished\n');
Starting Simulink simulation
Simulink simulation finished
Process Simulink output signals.
sl_correlatorIn = sl_out.correlatorIn(sl_out.correlatorInValid);
sl_demod = sl_out.demodData(sl_out.demodValid);
sl_SSBGrid = reshape(sl_demod(1:240*4),240,[]);
sl_locationPeaks = sl_out.locationPeaks(sl_out.locationPeaksValid);
sl_locations = find(sl_locationPeaks);
sl_correlationOut = sl_out.correlationOutput(sl_out.correlationValid,:);
sl_thresholdOut = sl_out.threshold(sl_out.correlationValid,:);
sl_SSBRawIQ = sl_out.ofdmInputData(sl_out.ofdmInputValid);
sl_nCellID2 = sl_out.PSSID(end);
Display and compare results
When the MATLAB and Simulink simulations are complete, display the simulation results.
Plot PSS correlation peaks and PSS threshold from MATLAB and Simulink, with plots zoomed in on region of detected PSS peak.
figure;
subplot(3,1,1);
plot(psscorr_mag_sq,'.-');
hold on;
plot(threshold);
title('MATLAB correlator outputs and threshold');

% Zoom in on first PSS peak and surrounding area.
xlimStart = min(sl_locations)-500;
xlimEnd = min(sl_locations)+15000;
xlim([xlimStart xlimEnd]);
legend('PSS 0','PSS 1','PSS 2','Threshold');
title('MATLAB PSS Correlation Results')
ylabel('Correlation');
xlabel('Locations');

subplot(3,1,2);
plot(sl_correlationOut,'.-');
hold on;
plot(sl_thresholdOut);
title('Simulink correlator outputs and threshold');

% Zoom in on first PSS peak and surrounding area.
xlim([xlimStart xlimEnd]);
legend('PSS 0','PSS 1','PSS 2','Threshold');
title('Simulink PSS Correlation Results')
ylabel('Correlation');
xlabel('Locations');

% Show difference between MATLAB and Simulink correlation values
subplot(3,1,3);
plot(abs(sl_correlationOut-psscorr_mag_sq(1:length(sl_correlationOut),:)));
hold on;
plot(abs(sl_thresholdOut-threshold(1:length(sl_thresholdOut))));

% Zoom in on first PSS peak and surrounding area.
xlim([xlimStart xlimEnd]);
legend('PSS 0','PSS 1','PSS 2','Threshold');
title(['Absolute value of error between MATLAB' newline 'and Simulink PSS Correlation Results'])
xlabel('Locations');

Display Simulink peak locations and nCellID2.
fprintf('Simulink Peak Location(s) \n');
fprintf('    %i \n',sl_locations);

fprintf('Simulink nCellID2 = %i \n', sl_nCellID2);
Simulink Peak Location(s)
    826
    2470
    4666
    6310
    8506
    10150
    12346
    13990
Simulink nCellID2 = 2
Plot the demodulated SSB grid from Simulink output signals.
figure;
imagesc(abs(sl_SSBGrid));
title('Simulink SSB Grid')
ylabel('Subcarrier');
xlabel('OFDM Symbol');

Calculate relative mean-squared error between MATLAB and Simulink IQ samples for the SSB grid before OFDM demodulation.
SSBIQ_MSE = 10*log10(sum(abs(ml_SSBRawIQ-sl_SSBRawIQ).^2)/sum(abs(ml_SSBRawIQ).^2));
fprintf('Relative mean-squared error between MATLAB and Simulink IQ samples for SSB grid at input to OFDM Demod:\n   %.1f dB\n',SSBIQ_MSE);
Relative mean-squared error between MATLAB and Simulink IQ samples for SSB grid at input to OFDM Demod:
   -88.7 dB
Calculate relative mean-squared error between MATLAB and Simulink SSB grids.
SSBGrid_MSE = 10*log10(sum(abs(ml_SSBGrid(:)-sl_SSBGrid(:)).^2)/sum(abs(ml_SSBGrid(:)).^2));
fprintf('Relative mean-squared error between MATLAB and Simulink SSB grids:\n   %.1f dB\n',SSBGrid_MSE);
Relative mean-squared error between MATLAB and Simulink SSB grids:
   -86.2 dB
Plot the difference between the MATLAB and Simulink SSB grids
figure;
subplot(2,1,1);
plot(real(ml_SSBGrid(:))-real(sl_SSBGrid(:)));
title(['Difference between MATLAB' newline 'and Simulink SSB grids (real)']);
subplot(2,1,2);
plot(imag(ml_SSBGrid(:))-imag(sl_SSBGrid(:)));
title(['Difference between MATLAB' newline 'and Simulink SSB grids (imag)']);

Decode the MIB from the Simulink SSB grid to further verify data recovered from the signal. If the bchCRC returned is 0 this indicates no errors were found.
fprintf('Decoding MIB from Simulink SSB grid \n');
Lmax = 8;
[mibStruct, nCellID, ssbIndex, bchCRC] = mibDecode(sl_SSBGrid, sl_nCellID2, Lmax);

if bchCRC == 0
    fprintf('MIB decode successful\n');
    disp([' Cell identity: ' num2str(nCellID)]);
else
    fprintf('MIB decode failed, bchCRC was non-zero\n')
end
Decoding MIB from Simulink SSB grid
MIB decode successful
 Cell identity: 17
HDL Code Generation
You can generate HDL code and an HDL testbench for the nrhdlSignalDetection/SSB Detect and Demod subsystem in the Simulink model using the makehdl and makehdltb commands. An HDL Coder™ license is required for HDL code generation. The resulting HDL code was synthesized for a Xilinx® Zynq®-7000 ZC706 evaluation board. The table shows the post place and route resource utilization results. The design meets timing with a clock frequency of 200 MHz.
T = table(...
    categorical({'Slice Registers'; 'Slice LUTs'; 'RAMB18'; 'RAMB36'; 'DSP48'}),...
    [32124; 13502; 10; 0; 315],...
    'VariableNames',{'Resource','Usage'});

disp(T);
       Resource        Usage
    _______________    _____

    Slice Registers    32124
    Slice LUTs         13502
    RAMB18                10
    RAMB36                 0
    DSP48                315
Further Exploration
You can modify the
scsSSBandSNRvariables to change the subcarrier spacing and noise level in the waveform that is generated. To generate more complex waveforms you can use 5G Toolbox to generate different signals to test the detector. For more information, see the Synchronization Signal Blocks and Bursts (5G Toolbox) example and the 5G NR Downlink Vector Waveform Generation (5G Toolbox) example.You can try adding impairments to the signal, such a frequency offset, to explore the impact on the detector.
You can try running the example on hardware. For more information, see the Introduction to 5G NR Signal Detection using AMD RFSoC (SoC Blockset) example or Introduction to 5G NR Signal Detection on NI USRP Radio (Wireless Testbench) example.
References
[1] 3GPP TS 38.211. "NR; Physical channels and modulation."