このページの内容は最新ではありません。最新版の英語を参照するには、ここをクリックします。
plot
パラメトリック モデルのプロット
説明
例
点群を含む MAT ファイルをワークスペースに読み込みます。
load("object3d.mat");点群を表示します。
figure
pcshow(ptCloud)
title("Detect a Cylinder in a Point Cloud")
円柱近似用に点から円柱までの最大距離を 5 mm に設定します。
maxDistance = 0.005;
関心領域 (ROI) を指定して、近似関数を制限します。
roi = [0.4 0.6; -inf 0.2; 0.1 inf];
sampleIndices = findPointsInROI(ptCloud,roi);
近似関数の方向の制約を設定します。
referenceVector = [0 0 1];
点群内の指定された ROI で円柱を検出し、抽出します。
model = pcfitcylinder(ptCloud,maxDistance,referenceVector, ...
        SampleIndices=sampleIndices);
検出された円柱のモデルをプロットします。
hold on
plot(model)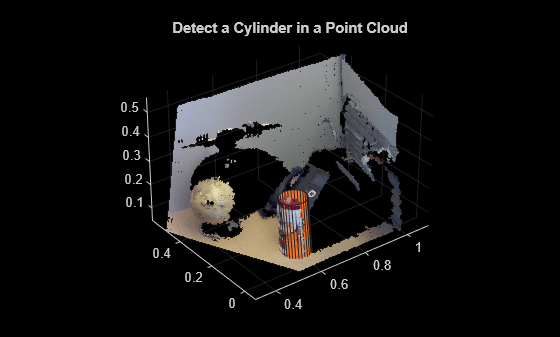
点群をワークスペースに読み込みます。
load("object3d.mat");点群を表示し、Figure にラベルを付けます。
figure
pcshow(ptCloud)
title("Detect a sphere in a point cloud")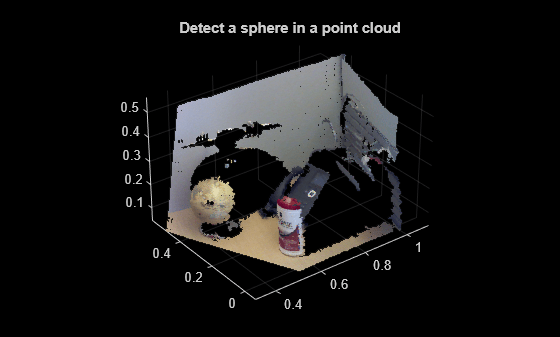
球近似用に点から球までの最大距離を 1 cm に設定します。
maxDistance = 0.01;
関心領域を設定して探索範囲を制限します。
roi = [-inf,0.5;0.2,0.4;0.1,inf];
sampleIndices = findPointsInROI(ptCloud,roi);
点群内で地球儀を検出して抽出します。
[model,inlierIndices] = pcfitsphere(ptCloud,maxDistance,SampleIndices=sampleIndices);
globe = select(ptCloud,inlierIndices);
抽出された地球儀をプロットします。
figure
pcshow(globe)
title("Globe Point Cloud")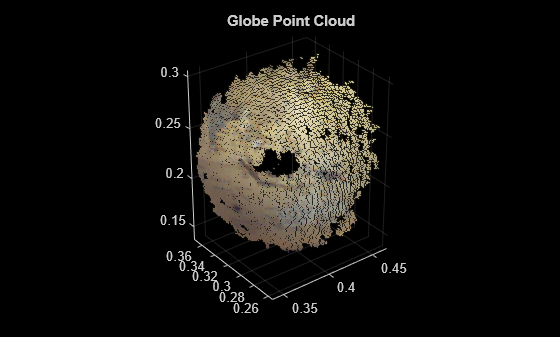
点群を含む MAT ファイルを読み込みます。
load("object3d.mat");点群をワークスペースに表示します。
figure
pcshow(ptCloud)
title("Detect a Plane in a Point Cloud")
平面近似用に点から平面までの最大距離を 2 cm に設定します。
maxDistance = 0.02;
近似平面の法線ベクトル平面を指定します。
referenceVector = [0 0 1];
近似平面の最大角距離を 5 度に設定します。
maxAngularDistance = 5;
点群内で平面 (テーブル) を検出し、抽出します。
model = pcfitplane(ptCloud,maxDistance,referenceVector,maxAngularDistance);
平面をプロットします。
hold on
plot(model)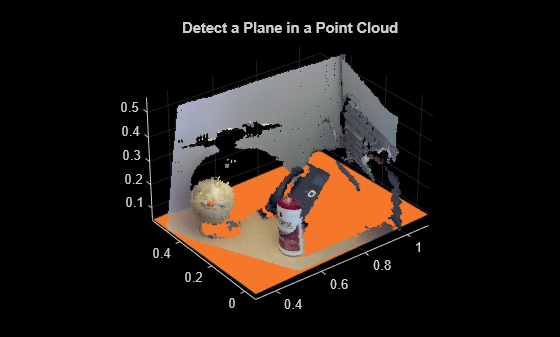
入力引数
名前と値の引数
オプションの引数のペアを Name1=Value1,...,NameN=ValueN として指定します。ここで、Name は引数名で、Value は対応する値です。名前と値の引数は他の引数の後に指定しなければなりませんが、ペアの順序は重要ではありません。
例: plot(model,Parent=gca) は、出力軸を現在の Figure の現在の座標軸に設定します。
平面の色。1 行 3 列の RGB ベクトル、または色の省略名や完全名として指定します。
| 色名 | 省略名 | RGB 3 成分 | 外観 |
|---|---|---|---|
"red" | "r" | [1 0 0] |
|
"green" | "g" | [0 1 0] |
|
"blue" | "b" | [0 0 1] |
|
"cyan" | "c" | [0 1 1] |
|
"magenta" | "m" | [1 0 1] |
|
"yellow" | "y" | [1 1 0] |
|
"black" | "k" | [0 0 0] |
|
"white" | "w" | [1 1 1] |
|


出力引数
バージョン履歴
R2015b で導入