文書の LDA トピック確率の可視化
この例では、潜在的ディリクレ配分 (LDA) トピック モデルを使用して文書のトピック確率を可視化する方法を示します。
潜在的ディリクレ配分 (LDA) モデルは、文書のコレクションに内在するトピックを発見し、トピック内の単語の確率を推測するトピック モデルです。LDA モデルを使用すると、文書をトピック確率のベクトル (トピックの混合率とも呼ばれます) に変換できます。積み上げ棒グラフを使用して LDA トピックを可視化できます。
LDA モデルの読み込み
さまざまな障害イベントの詳細を示す工場レポートのデータ セットを使用して学習させた LDA モデル factoryReportsLDAModel を読み込みます。LDA モデルをテキスト データのコレクションに当てはめる方法を示す例については、トピック モデルを使用したテキスト データの解析を参照してください。
load factoryReportsLDAModel
mdl
mdl =
ldaModel with properties:
NumTopics: 7
WordConcentration: 1
TopicConcentration: 0.5755
CorpusTopicProbabilities: [0.1587 0.1573 0.1551 0.1534 0.1340 0.1322 0.1093]
DocumentTopicProbabilities: [480×7 double]
TopicWordProbabilities: [158×7 double]
Vocabulary: ["item" "occasionally" "get" "stuck" "scanner" "spool" "loud" "rattling" "sound" "come" "assembler" "piston" "cut" "power" "start" "plant" "capacitor" "mixer" … ]
TopicOrder: 'initial-fit-probability'
FitInfo: [1×1 struct]
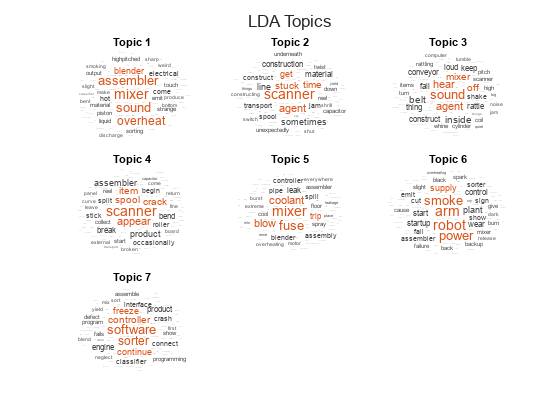
ワード クラウドを使用したトピックの可視化
wordcloud 関数を使用してトピックを可視化します。
numTopics = mdl.NumTopics;
figure
t = tiledlayout("flow");
title(t,"LDA Topics")
for i = 1:numTopics
    nexttile
    wordcloud(mdl,i);
    title("Topic " + i)
end
文書内のトピックの混合率の表示
モデルの当てはめ時に使用したのと同じ前処理関数を使用して、まだ見ていない文書のセットについて、トークン化された文書の配列を作成します。
この例の前処理関数セクションにリストされている関数 preprocessText は、以下の手順を順番に実行します。
tokenizedDocumentを使用してテキストをトークン化する。normalizeWordsを使用して単語をレンマ化する。erasePunctuationを使用して句読点を消去する。removeStopWordsを使用して、ストップ ワード ("and"、"of"、"the" など) のリストを削除する。removeShortWordsを使用して、2 文字以下の単語を削除する。removeLongWordsを使用して、15 文字以上の単語を削除する。
関数 preprocessText を使用して、解析用のテキスト データを準備します。
str = [
    "Coolant is pooling underneath assembler."
    "Sorter blows fuses at start up."
    "There are some very loud rattling sounds coming from the assembler."];
documents = preprocessText(str);
transform 関数を使用して、文書をトピック確率のベクトルに変換します。非常に短い文書の場合、トピックの混合率は文書のコンテンツを強力に表現するものではない可能性があることに注意してください。
topicMixtures = transform(mdl,documents);
最初のトピックの混合率を棒グラフで可視化し、各トピックの上位 3 つの単語を使用してバーにラベルを付けます。
numTopics = mdl.NumTopics;
for i = 1:numTopics
    top = topkwords(mdl,3,i);
    topWords(i) = join(top.Word,", ");
end

figure
bar(categorical(topWords),topicMixtures(1,:))

xlabel("Topic")
ylabel("Probability")
title("Document Topic Probabilities")

各文書に含まれるトピックの割合を可視化したり、複数のトピックの混合率を可視化したりするには、積み上げ棒グラフを使用します。
figure
barh(topicMixtures,"stacked")

title("Topic Mixtures")
xlabel("Topic Probability")
ylabel("Document")

legend(topWords, ...
    Location="southoutside", ...
    NumColumns=2)
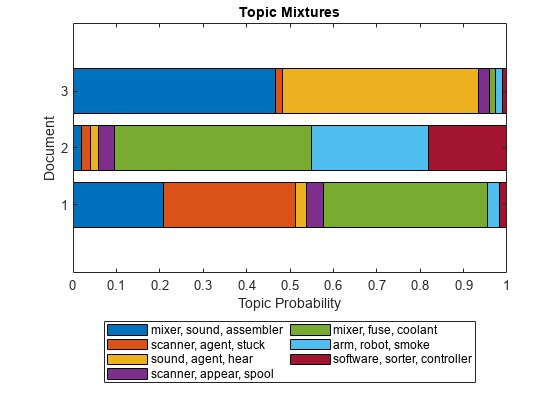
積み上げ棒グラフの領域は、対応するトピックに属する文書の割合を表します。
前処理関数
関数 preprocessText は、以下の手順を順番に実行します。
tokenizedDocumentを使用してテキストをトークン化する。normalizeWordsを使用して単語をレンマ化する。erasePunctuationを使用して句読点を消去する。removeStopWordsを使用して、ストップ ワード ("and"、"of"、"the" など) のリストを削除する。removeShortWordsを使用して、2 文字以下の単語を削除する。removeLongWordsを使用して、15 文字以上の単語を削除する。
function documents = preprocessText(textData)

% Tokenize the text.
documents = tokenizedDocument(textData);

% Lemmatize the words.
documents = addPartOfSpeechDetails(documents);
documents = normalizeWords(documents,Style="lemma");

% Erase punctuation.
documents = erasePunctuation(documents);

% Remove a list of stop words.
documents = removeStopWords(documents);

% Remove words with 2 or fewer characters, and words with 15 or greater
% characters.
documents = removeShortWords(documents,2);
documents = removeLongWords(documents,15);

end
参考
tokenizedDocument | fitlda | ldaModel | wordcloud