LDA トピックの相関の可視化
この例では、潜在的ディリクレ配分 (LDA) トピック モデルでトピック間の相関を解析する方法を示します。
潜在的ディリクレ配分 (LDA) モデルは、文書のコレクションに内在するトピックを発見し、トピック内の単語の確率を推測するトピック モデルです。トピック単位の単語確率のベクトルがトピックを特徴付けます。トピック単位の単語確率を使用して、トピック間の相関を特定することができます。
LDA モデルの読み込み
さまざまな障害イベントの詳細を示す工場レポートのデータ セットを使用して学習させた LDA モデル factoryReportsLDAModel を読み込みます。LDA モデルをテキスト データのコレクションに当てはめる方法を示す例については、トピック モデルを使用したテキスト データの解析を参照してください。
load factoryReportsLDAModel
mdl
mdl =
ldaModel with properties:
NumTopics: 7
WordConcentration: 1
TopicConcentration: 0.5755
CorpusTopicProbabilities: [0.1587 0.1573 0.1551 0.1534 0.1340 0.1322 0.1093]
DocumentTopicProbabilities: [480×7 double]
TopicWordProbabilities: [158×7 double]
Vocabulary: ["item" "occasionally" "get" "stuck" "scanner" "spool" "loud" "rattling" "sound" "come" "assembler" "piston" "cut" "power" "start" "plant" "capacitor" "mixer" … ]
TopicOrder: 'initial-fit-probability'
FitInfo: [1×1 struct]
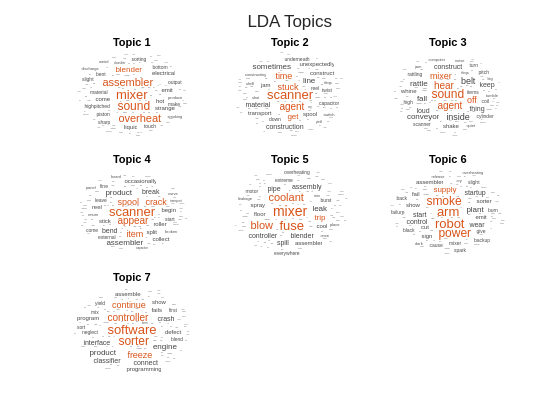
ワード クラウドを使用してトピックを可視化します。
numTopics = mdl.NumTopics;

figure
t = tiledlayout("flow");
title(t,"LDA Topics")

for i = 1:numTopics
    nexttile
    wordcloud(mdl,i);
    title("Topic " + i)
end
トピックの相関の可視化
LDA モデルのトピック ワード確率を入力として関数 corrcoef を使用し、トピック間の相関を計算します。
correlation = corrcoef(mdl.TopicWordProbabilities);
相関をヒート マップで表示し、各トピックに上位 3 つの単語のラベルを付けます。トピック間の自明な相関がヒート マップで強調されないようにするには、相関から単位行列を減算します。
各トピックについて、上位 3 つの単語を見つけます。
numTopics = mdl.NumTopics;
for i = 1:numTopics
    top = topkwords(mdl,3,i);
    topWords(i) = join(top.Word,", ");
end
関数 heatmap を使用して相関をプロットします。
figure
heatmap(correlation - eye(numTopics), ...
    XDisplayLabels=topWords, ...
    YDisplayLabels=topWords)

title("LDA Topic Correlations")
xlabel("Topic")
ylabel("Topic")

トピックごとに、最も強い相関をもつトピックを見つけ、そのペアを対応する相関係数とともに table に表示します。
[topCorrelations,topCorrelatedTopics] = max(correlation - eye(numTopics));

tbl = table;
tbl.TopicIndex = (1:numTopics)';
tbl.Topic = topWords';
tbl.TopCorrelatedTopicIndex = topCorrelatedTopics';
tbl.TopCorrelatedTopic = topWords(topCorrelatedTopics)';
tbl.CorrelationCoefficient = topCorrelations'
tbl=7×5 table
    1         "mixer, sound, assembler"    5            "mixer, fuse, coolant"    0.3430
    2           "scanner, agent, stuck"    4          "scanner, appear, spool"    0.3453
    3              "sound, agent, hear"    1         "mixer, sound, assembler"    0.2691
    4          "scanner, appear, spool"    2           "scanner, agent, stuck"    0.3453
    5            "mixer, fuse, coolant"    1         "mixer, sound, assembler"    0.3430
    6               "arm, robot, smoke"    1         "mixer, sound, assembler"    0.0042
    7    "software, sorter, controller"    7    "software, sorter, controller"         0
参考
tokenizedDocument | fitlda | ldaModel | wordcloud