関数呼び出し入力イベントによって有効になったチャートでのステートの制御
この例では、[イネーブル時の状態] チャート プロパティを設定することで、関数呼び出しの入力イベントによってイネーブルにされる Stateflow® チャートのステートを制御する方法を示します。このプロパティは、入力イベントによってチャートが再度イネーブルにされるときのステートとデータの値を決定します。
Held— ステートとデータの最新の値を保持。Reset— ステートとデータの初期値に戻す。
新しいチャートの場合、既定の設定は Held です。詳細については、入力イベントの送信による Stateflow チャートのアクティブ化を参照してください。
関数呼び出しの入力イベントによってイネーブルにされるチャートの例
以下のモデルでは、Caller チャートはイベント E を使用して Callee チャートを起動し、実行します。

Caller チャートには 2 つのステート、A と B が含まれています。出力イベント E をステート A にバインドすると、次のようになります。
Aを入力してCalleeチャートを有効化します。Aを終了してCalleeチャートを無効にします。Aを再入力してCalleeチャートを再び有効にします。
時相論理演算子afterは、10 タイム ステップごとにアクティブ ステートを変更するので、Callee チャートは繰り返しイネーブルおよびディセーブルにされます。

Callee チャートには 2 つのステート、C と D が含まれています。チャートが実行されるたびに、出力データ y が 1 ずつ増分されます。最初は、ステート C はアクティブです。1 タイム ステップの後、y の値が正になり、チャートはステート D に遷移します。

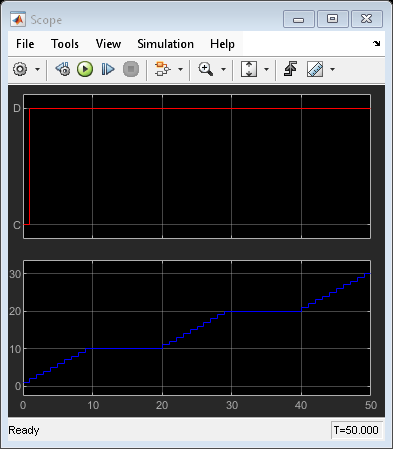
プロパティが Held の場合のチャートのシミュレーション
Callee チャートでは [イネーブル時の状態] プロパティが Held に設定されています。シミュレーション中に、関数呼び出し入力イベントが時間  および
および  でチャートを再度イネーブルにすると、ステート
 D がアクティブのままになり、出力 y は最新の値を保持します。

プロパティが Reset の場合のチャートのシミュレーション
Callee チャートで [イネーブル時の状態] プロパティを Reset に変更します。シミュレーション中に、関数呼び出し入力イベントが時間  および
および  でチャートを再度イネーブルにすると、ステート
 C がアクティブになり、出力 y は初期値 0 に戻ります。
