Main Content

slmetric.dashboard.CustomWidget クラス

名前空間: slmetric.dashboard

(削除予定) カスタム メトリクス ダッシュボード ウィジェットを保持するオブジェクト

メトリクス ダッシュボード ユーザー インターフェイス、関数 metricdashboardslmetric パッケージ API、および対応するカスタマイズは将来のリリースで削除される予定です。詳細については、Migrating from Metrics Dashboard to Model Maintainability Dashboardを参照してください。

説明

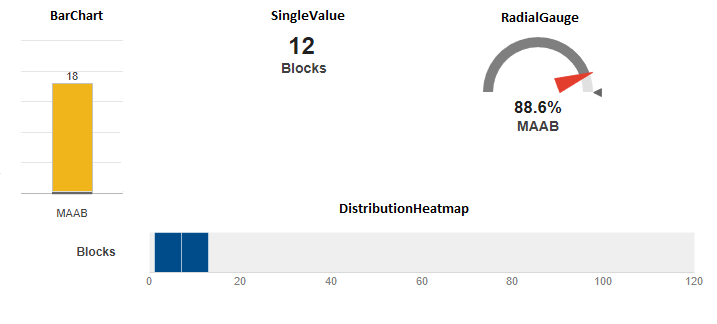
カスタム メトリクスまたは出荷時のメトリクスについて、slmetric.dashboard.CustomWidget オブジェクトを使用して、メトリクス ダッシュボードでメトリクス データを可視化します。単一値、放射状ゲージ、棒グラフ、または分布ヒートマップの方法を選択します。

作成

slmetric.dashboard.Layoutslmetric.dashboard.Container、または slmetric.dashboard.Group オブジェクトに対して、addWidget メソッドまたは removeWidget メソッドを使用してメトリクス ダッシュボードで slmetric.dashboard.CustomWidget オブジェクトを追加または削除します。

メトリクス ダッシュボード レイアウトは同じサイズの 12 列に分割されます。slmetric.dashboard.CustomWidget メソッドを使用して、ウィジェットのサイズを指定します。

ウィジェットで表示するメトリクス データを指定するには、setMetricIDs メソッドを使用してメトリクス ID をウィジェットに割り当てます。カスタム ウィジェットは、指定したメトリクス ID の数に合わせて自動的にスケーリングされます。たとえば、カスタム棒グラフ ウィジェットを作成し、2 つのメトリクス ID を指定すると、棒グラフ ウィジェットは棒グラフで 2 本の棒を使用してメトリクス結果を表示します。

プロパティ

すべて展開する

メトリクス ダッシュボードで追加、削除、または変更する slmetric.dashboard.CustomWidget オブジェクトのタイプ。このプロパティは読み取りと書き込みが可能です。以下のウィジェット タイプから選択します。

  • 棒グラフ

  • 単一値

  • 放射状ゲージ

  • 分布ヒートマップ

Examples of each widget type

各種可視化タイプを使用する方法の例については、カスタム メトリクスをもつレイアウトを作成するを参照してください。

データ型: char

ラベルをカスタム ウィジェットに追加します。このプロパティは BarChart VisualizationType プロパティ専用であるため、個々のバーにラベルを追加できます。このプロパティは読み取りと書き込みが可能です。

データ型: char

カスタム ウィジェットのタイトルを指定します。放射状ゲージでは、16 文字の文字数制限があります。このプロパティは読み取りと書き込みが可能です。

データ型: char

slmetric.dashboard.CustomWidget オブジェクトのタイプ。このプロパティは読み取り専用です。

データ型: char

メソッド

getHeight(To be removed) Obtain height of Metrics Dashboard custom widget
getMetricIDs(To be removed) Obtain metric identifier for custom Metrics Dashboard widget
getPosition(To be removed) Obtain custom widget position within Metrics Dashboard
getSeparators(To be removed) Determine whether there are lines on sides of Metrics Dashboard custom widget
getWidths(To be removed) Obtain widths of Metrics Dashboard custom widget
setHeight(To be removed) Specify height of Metrics Dashboard custom widget
setMetricIDs(To be removed) Set metric identifier for custom Metrics Dashboard widget
setPosition(To be removed) Set custom widget position within Metrics Dashboard
setSeparators(To be removed) Specify lines on Metrics Dashboard custom widget sides
setWidths(To be removed) Specify multiples widths for Metrics Dashboard custom widget

すべて折りたたむ

非バーチャル ブロック数をカウントするカスタム メトリクスを作成します。このメトリクスをメトリクス ダッシュボードに表示するウィジェットを指定します。それをサイズ グループに追加します。

以下を入力してモデル vdp を開きます。

openExample('simulink_general/VanDerPolOscillatorExample')

カスタム メトリクス クラスを作成します。

className = 'nonvirtualblockcount';
slmetric.metric.createNewMetricClass(className);

以下のコードを nonvirtualblockcount.m ファイルに追加して、非バーチャル ブロックをカウントするメトリクスを作成します。

classdef nonvirtualblockcount < slmetric.metric.Metric
    %nonvirtualblockcount calculates number of nonvirtual blocks per level.
    % BusCreator, BusSelector and BusAssign are treated as nonvirtual.
    properties
        VirtualBlockTypes = {'Demux','From','Goto','Ground', ...
            'GotoTagVisibility','Mux','SignalSpecification', ...
            'Terminator','Inport'};
    end
    
    methods
    function this = nonvirtualblockcount()
        this.ID = 'nonvirtualblockcount';
        this.Name = 'Nonvirtual Block Count';
        this.Version = 1;
        this.CompileContext = 'None';
        this.Description = 'Algorithm that counts nonvirtual blocks per level.';
        this.AggregatedValueName = 'Nonvirtual Blocks (incl. Descendants)'
        this.ValueName = 'Nonvirtual Blocks'
        this.ComponentScope = [Advisor.component.Types.Model, ...
            Advisor.component.Types.SubSystem];
        this.AggregationMode = slmetric.AggregationMode.Sum;
        this.ResultChecksumCoverage = true;
        this.SupportsResultDetails = true;
            
    end

    function res = algorithm(this, component)
        % create a result object for this component
        res = slmetric.metric.Result();	

        % set the component and metric ID
        res.ComponentID = component.ID;
        res.MetricID = this.ID;
        
        % Practice
        D1=slmetric.metric.ResultDetail('identifier 1','Name 1');
        D1.Value=0;
        D1.setGroup('Group1','Group1Name');
        D2=slmetric.metric.ResultDetail('identifier 2','Name 2');
        D2.Value=1;
        D2.setGroup('Group1','Group1Name');


        % use find_system to get blocks inside this component
        blocks = find_system(getPath(component), ...
            'SearchDepth', 1, ...
            'Type', 'Block');

        isNonVirtual = true(size(blocks));

        for n=1:length(blocks)
            blockType = get_param(blocks{n}, 'BlockType');

            if any(strcmp(this.VirtualBlockTypes, blockType))
                isNonVirtual(n) = false;
            else
                switch blockType
                    case 'SubSystem'
                        % Virtual unless the block is conditionally executed
                        % or the Treat as atomic unit check box is selected.
                        if strcmp(get_param(blocks{n}, 'IsSubSystemVirtual'), ...
                                'on')
                            isNonVirtual(n) = false;
                        end
                    case 'Outport'
                        % Outport: Virtual when the block resides within
                        % SubSystem block (conditional or not), and 
                        % does not reside in the root (top-level) Simulink window.
                        if component.Type ~= Advisor.component.Types.Model
                            isNonVirtual(n) = false;
                        end
                    case 'Selector'
                        % Virtual only when Number of input dimensions 
                        % specifies 1 and Index Option specifies Select 
                        % all, Index vector (dialog), or Starting index (dialog).
                        nod = get_param(blocks{n}, 'NumberOfDimensions');
                        ios = get_param(blocks{n}, 'IndexOptionArray');

                        ios_settings = {'Assign all', 'Index vector (dialog)', ...
                            'Starting index (dialog)'};

                        if nod == 1 && any(strcmp(ios_settings, ios))
                            isNonVirtual(n) = false;
                        end
                    case 'Trigger'
                        % Virtual when the output port is not present.
                        if strcmp(get_param(blocks{n}, 'ShowOutputPort'), 'off')
                            isNonVirtual(n) = false;
                        end
                    case 'Enable'
                        % Virtual unless connected directly to an Outport block.
                        isNonVirtual(n) = false;

                        if strcmp(get_param(blocks{n}, 'ShowOutputPort'), 'on')
                            pc = get_param(blocks{n}, 'PortConnectivity');

                            if ~isempty(pc.DstBlock) && ...
                                    strcmp(get_param(pc.DstBlock, 'BlockType'), ...
                                    'Outport')
                                isNonVirtual(n) = true;
                            end
                        end
                end
            end
        end

        blocks = blocks(isNonVirtual);

        res.Value = length(blocks);
    end
    end
end

この新しいメトリクスをメトリクス リポジトリに登録します。

[id_metric,err_msg] = slmetric.metric.registerMetric(className);

まず、メトリクス ダッシュボード レイアウトの既定の構成を開きます。

conf = slmetric.dashboard.Configuration.open();

slmetric.dashboard.Layout オブジェクトを slmetric.dashboard.Configuration オブジェクトから取得します。

layout = getDashboardLayout(conf);

レイアウト オブジェクト内のウィジェット オブジェクトを取得します。

layoutWidget = getWidgets(layout);

Simulink ブロックをカウントするメトリクスを表現するウィジェットを削除します。

sizeGroup = layoutWidget(2); 
sizeGroupWidgets = sizeGroup.getWidgets(); 
sizeGroup.removeWidget(sizeGroupWidgets(1));

非バーチャル ブロックをカウントするメトリクスを表示するウィジェットを追加します。カスタム ウィジェットの場合、既定の可視化タイプは単一値です。これ以外の可視化手法を使用する場合、VisualizationType プロパティに別の値を指定してください。

newWidget = sizeGroup.addWidget('Custom', 1);
newWidget.Title = ('Nonvirtual Block Count'); 
newWidget.setMetricIDs('nonvirtualblockcount');
newWidget.setWidths(slmetric.dashboard.Width.Medium);
newWidget.setHeight(70);

グループ内でカスタム ウィジェットと他のウィジェットを区切るラインを表示するかどうかを指定します。次のコマンドは、ウィジェットの右側にラインが表示されることを指定します。

s.top = false;
s.bottom = false;
s.left = false;
s.right = true;
newWidget.setSeparators([s, s, s, s]);

構成オブジェクトを保存します。以下のコマンドは、API 情報を XML ファイルにシリアル化します。

save(conf,'Filename','DashboardConfig.xml');

アクティブな構成を設定します。

slmetric.dashboard.setActiveConfiguration(fullfile(pwd,'DashboardConfig.xml'));

モデル vdp のメトリクス ダッシュボードを開きます。

metricsdashboard vdp

[すべてのメトリクス] ボタンをクリックしてすべてのメトリクスを実行します。

バージョン履歴

R2018b で導入

すべて折りたたむ

R2022a: メトリクス ダッシュボードは削除予定

メトリクス ダッシュボード ユーザー インターフェイス、関数 metricdashboardslmetric パッケージ API、および対応するカスタマイズは将来のリリースで削除される予定です。詳細については、Migrating from Metrics Dashboard to Model Maintainability Dashboardを参照してください。