removeHighlight
Syntax
Description
Examples
The model for this example implements the second-order differential Van der Pol (vdp) equation.
,
where represents damping in the system.
Open the model vdp. In the model, the signal x1 represents the first derivative of . The signal x2 represents the second derivative of .
mdl = "vdp";
open_system(mdl)
Use the sltrace function to trace all source blocks for the signal x2, which is the input signal for the Integrator block named x1.
x2Sources = sltrace((mdl + "/x1"),"Source",Port=1,TraceAll="on");
When you trace all sources for a signal, the sltrace.Graph object that the sltrace function returns contains information about more than just the blocks that produce the input signals for the specified block. The sltrace.Graph object contains information for all blocks that produce output values that affect the value of the signal you trace.
length(x2Sources.SrcBlocks)
ans =
10
To see the signal path in the block diagram, use the highlight function to highlight all the source blocks in the sltrace.Graph object x2Sources. The source blocks in the sltrace.Graph object and the signals that connect them are highlighted yellow in the block diagram. Highlighting the blocks also shades the canvas a darker gray to make the highlighting more visible.
highlight(x2Sources)

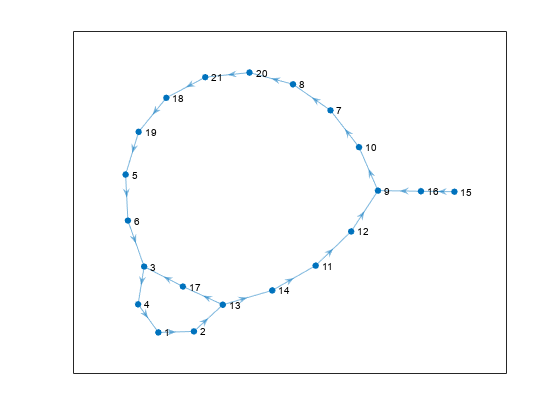
The sltrace.Graph object includes a digraph object you can use to analyze the connections among the source blocks. Each node in the graph represents a block port, and each edge, or line, represents a signal line.
plot(x2Sources.TraceGraph)

Once you have an sltrace.Graph object, you can use the highlight function to highlight any block or signal line in the model, including blocks and signal lines that are not part of the signal trace information in the sltrace.Graph object. For example, highlight the Scope block and the signal lines connected to the input ports on the Scope block.
Use the get_param function to get the block handle for the Scope block.
scopePath = mdl + "/Scope";
scopeHandle = get_param(scopePath,"Handle");
Use the get_param function to get the port handles for the Scope block.
scopePorts = get_param(scopePath,"PortHandles");Use the get_param function to get the line handle for the signal line connected to each input port of the Scope block.
scopeIn1 = scopePorts.Inport(1);
scopeIn1 = get_param(scopeIn1,"Line");
scopeIn2 = scopePorts.Inport(2);
scopeIn2 = get_param(scopeIn2,"Line");
Use the highlight function to highlight the elements in the block diagram. The Scope block and the input signals for the Scope block are highlighted red in the block diagram, which still shows the yellow highlighting on the sources for the signal x2.
highlight(x2Sources,[scopeHandle scopeIn1 scopeIn2])

To remove the highlighting, use the removeHighlight function. The function removes all highlighting in the block diagram associated with the sltrace.Graph object. When the block diagram contains no highlighting, the shading in the canvas is also removed.
removeHighlight(x2Sources)

Input Arguments
Signal tracing path, specified as an sltrace.Graph object.
Version History
Introduced in R2021b
See Also
Objects
Functions
MATLAB Command
You clicked a link that corresponds to this MATLAB command:
Run the command by entering it in the MATLAB Command Window. Web browsers do not support MATLAB commands.
Web サイトの選択
Web サイトを選択すると、翻訳されたコンテンツにアクセスし、地域のイベントやサービスを確認できます。現在の位置情報に基づき、次のサイトの選択を推奨します:
また、以下のリストから Web サイトを選択することもできます。
最適なサイトパフォーマンスの取得方法
中国のサイト (中国語または英語) を選択することで、最適なサイトパフォーマンスが得られます。その他の国の MathWorks のサイトは、お客様の地域からのアクセスが最適化されていません。
南北アメリカ
- América Latina (Español)
- Canada (English)
- United States (English)
ヨーロッパ
- Belgium (English)
- Denmark (English)
- Deutschland (Deutsch)
- España (Español)
- Finland (English)
- France (Français)
- Ireland (English)
- Italia (Italiano)
- Luxembourg (English)
- Netherlands (English)
- Norway (English)
- Österreich (Deutsch)
- Portugal (English)
- Sweden (English)
- Switzerland
- United Kingdom (English)