sltrace.Graph
Description
An sltrace.Graph object stores information about a signal path
traced using the sltrace
function. Use the signal tracing programmatic interface to programmatically analyze the
structure of a model by tracing a signal to one or more source or destination blocks. You can
also use the signal tracing programmatic interface to build your own custom tracing
tool.
You can use an sltrace.Graph object to:
Highlight the signal path in the model.
Highlight any block in the model, including blocks that are not on the signal path.
Create a directed graph plot of the signal path.
Creation
Create an sltrace.Graph object by tracing a signal path using the
sltrace
function.
Properties
Object Functions
highlight | Highlight path to signal sources or destinations in model |
removeHighlight | Remove highlighting for sltrace.Graph object from
model |
Examples
The model for this example implements the second-order differential Van der Pol (vdp) equation.
,
where represents damping in the system.
Open the model vdp. In the model, the signal x1 represents the first derivative of . The signal x2 represents the second derivative of .
mdl = "vdp";
open_system(mdl)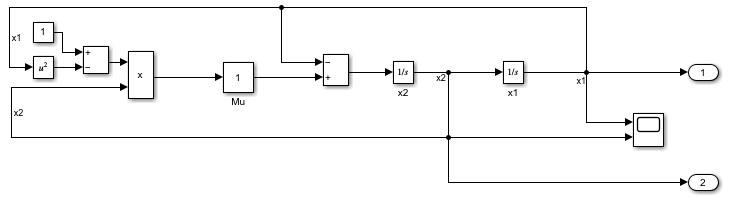
Use the sltrace function to trace all source blocks for the signal x2, which is the input signal for the Integrator block named x1.
x2Sources = sltrace((mdl + "/x1"),"Source",Port=1,TraceAll="on");
When you trace all sources for a signal, the sltrace.Graph object that the sltrace function returns contains information about more than just the blocks that produce the input signals for the specified block. The sltrace.Graph object contains information for all blocks that produce output values that affect the value of the signal you trace.
length(x2Sources.SrcBlocks)
ans =
10
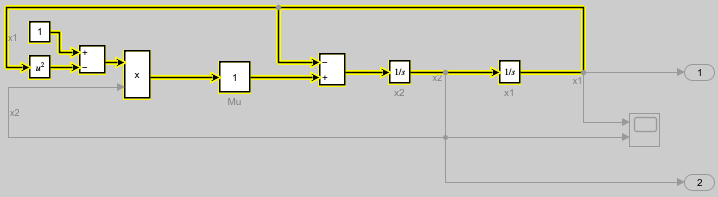
To see the signal path in the block diagram, use the highlight function to highlight all the source blocks in the sltrace.Graph object x2Sources. The source blocks in the sltrace.Graph object and the signals that connect them are highlighted yellow in the block diagram. Highlighting the blocks also shades the canvas a darker gray to make the highlighting more visible.
highlight(x2Sources)
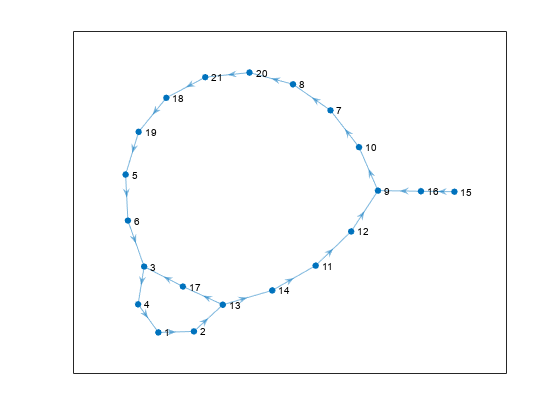
The sltrace.Graph object includes a digraph object you can use to analyze the connections among the source blocks. Each node in the graph represents a block port, and each edge, or line, represents a signal line.
plot(x2Sources.TraceGraph)
Once you have an sltrace.Graph object, you can use the highlight function to highlight any block or signal line in the model, including blocks and signal lines that are not part of the signal trace information in the sltrace.Graph object. For example, highlight the Scope block and the signal lines connected to the input ports on the Scope block.
Use the get_param function to get the block handle for the Scope block.
scopePath = mdl + "/Scope";
scopeHandle = get_param(scopePath,"Handle");
Use the get_param function to get the port handles for the Scope block.
scopePorts = get_param(scopePath,"PortHandles");Use the get_param function to get the line handle for the signal line connected to each input port of the Scope block.
scopeIn1 = scopePorts.Inport(1);
scopeIn1 = get_param(scopeIn1,"Line");
scopeIn2 = scopePorts.Inport(2);
scopeIn2 = get_param(scopeIn2,"Line");
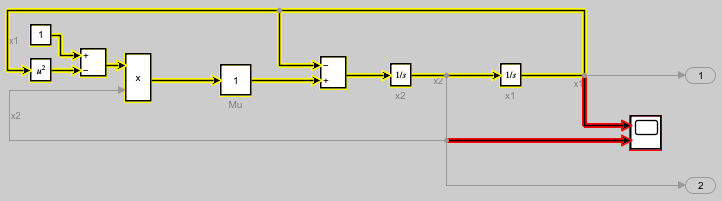
Use the highlight function to highlight the elements in the block diagram. The Scope block and the input signals for the Scope block are highlighted red in the block diagram, which still shows the yellow highlighting on the sources for the signal x2.
highlight(x2Sources,[scopeHandle scopeIn1 scopeIn2])
To remove the highlighting, use the removeHighlight function. The function removes all highlighting in the block diagram associated with the sltrace.Graph object. When the block diagram contains no highlighting, the shading in the canvas is also removed.
removeHighlight(x2Sources)

Version History
Introduced in R2021b