メインコンテンツ

timeSeriesIforestAD

Create a machine learning isolation forest anomaly detector model for time series data

Since R2026a

Description

Add-On Required: This feature requires the Time Series Anomaly Detection for MATLAB add-on.

timeSeriesIforestAD creates an anomaly detector based on the machine learning Isolated Forest algorithm. This algorithm is detects anomalies by isolating anomalous data from normal data using an ensemble of isolation trees.

For more information on the model that timeSeriesIforestAD creates, see TimeSeriesIForestDetector.

detector = timeSeriesIforestAD(numChannels) creates a TimeseriesIForestDetector model for time series data with numChannels input channels.

example

detector = timeSeriesIforestAD(numChannels,Name=Value) sets additional options using one or more name-value arguments.

For example, detector = timeSeriesIforestAD(3,NumLearners=120) creates a an isolation forest with three input channels and 120 trees. detector = timeSeriesIforestAD(3,DetectionWindowLength=20) creates a detector model with a detection window length of 20.

Examples

collapse all

Load the file sineWaveAnomalyData.mat, which contains two sets of synthetic 3-channel sinusoidal signals.

sineWaveNormal contains 10 sinusoids of stable frequency and amplitude. Each signal has a series of small-amplitude impact-like imperfections. The signals have different lengths and initial phases. sineWaveAbnormal contains 3 sinusoids that contain the same normal data as sineWaveNormal, but that also include anomalous data.

load sineWaveAnomalyData.mat sineWaveNormal sineWaveAbnormal

Plot input signals

Plot all 3 channels of the first three anomalous signals.

s1 = 3;
tiledlayout("vertical")
ax = zeros(s1,1);
for kj = 1:s1
    ax(kj) = nexttile;
    plot(sineWaveAbnormal{kj})
    title("Anomalous Signals")
end

Figure contains 3 axes objects. Axes object 1 with title Anomalous Signals contains 3 objects of type line. Axes object 2 with title Anomalous Signals contains 3 objects of type line. Axes object 3 with title Anomalous Signals contains 3 objects of type line.

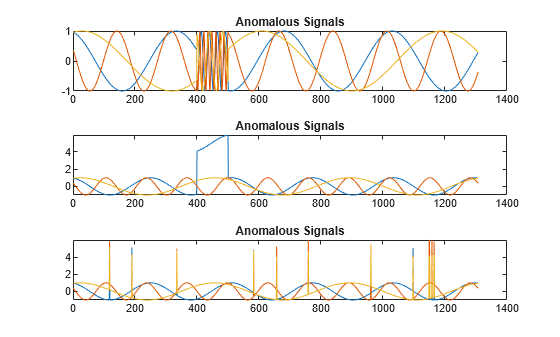
sineWaveAbnormal contains three signals, all of the same length. Each signal in the set has one or more anomalies.

  • All channels of the first signal have an abrupt change in frequency that lasts for a finite time.

  • The second signal has a finite-duration amplitude change in one of its channels.

  • The third signal has spikes at random times in all channels.

Create Detector

Use the timeseriesIforestAD detector to create an Isolated Forest detector with 3 channels and default options.

detector_tsif = timeSeriesIforestAD(3)
detector_tsif = 
  TimeSeriesIForestDetector with properties:

                  NumLearners: 100
    NumObservationsPerLearner: []
                  NumChannels: 3
                    IsTrained: 0
                 WindowLength: 10
               TrainingStride: 1
              DetectionStride: 10
                    Threshold: []
              ThresholdMethod: "kSigma"
           ThresholdParameter: 3
            ThresholdFunction: []
                Normalization: "zscore"
            FeatureExtraction: 1

Train detector using the normal data.

detector_tsif = train(detector_tsif,sineWaveNormal);

View the threshold that train computes and saves within detector_tsif. This computed value is influenced by random factors, such as which subsets of the data are used for training, and can change somewhat for different training sessions and different machines.

thresh = detector_tsif.Threshold
thresh = 
0.5867

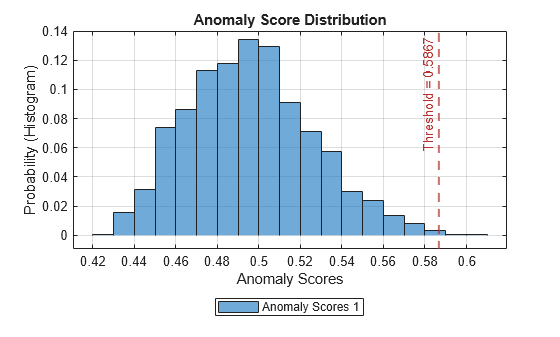
Plot the histogram of the anomaly scores for the normal data. Each score is calculated over a single detection window. The threshold, plotted as a vertical line, does not always completely bound the scores.

plotHistogram(detector_tsif,sineWaveNormal);

Figure contains an axes object. The axes object with title Anomaly Score Distribution, xlabel Anomaly Scores, ylabel Probability (Histogram) contains 2 objects of type histogram, constantline. This object represents Anomaly Scores 1.

Use Detector to Identify Anomalies

Use the detect function to determine the anomaly scores for the anomalous data. Then, plot the anomaly scores.

results = detect(detector_tsif, sineWaveAbnormal)
results=3×1 cell array
    {130×3 table}
    {130×3 table}
    {130×3 table}

results is a cell array that contains three tables, one table for each signal. Each cell table contains three variables: WindowLabel, WindowAnomalyScore, and WindowStartIndices. Confirm the table variable names.

varnames = results{1}.Properties.VariableNames
varnames = 1×3 cell
    {'Labels'}    {'AnomalyScores'}    {'StartIndices'}

Plot Anomaly Score Distributions

Plot a histogram that shows the anomaly scores for both sets of data together, along with the threshold, for comparison.

plotHistogram(detector_tsif,sineWaveNormal,sineWaveAbnormal)

Figure contains an axes object. The axes object with title Anomaly Score Distribution, xlabel Anomaly Scores, ylabel Probability (Histogram) contains 3 objects of type histogram, constantline. These objects represent Anomaly Scores 1, Anomaly Scores 2.

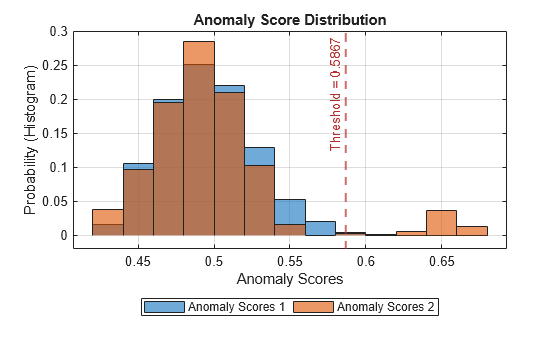
The histogram uses different colors for the normal (Data 1) and anomalous (Data 2) data. Both types of data appear to the left of the threshold. To the right of threshold, Data 2 is prevalent.

Plot the detected anomalies of the third abnormal signal set.

plot(detector_tsif,sineWaveAbnormal{3})

Figure contains 2 axes objects. Axes object 1 with title Anomalies, xlabel Samples, ylabel Signal contains 7 objects of type patch, line. These objects represent Labeled Anomalies, Raw Signal (Channel 3), Raw Signal (Channel 2), Raw Signal (Channel 1), Detected Anomalies (Channel 3), Detected Anomalies (Channel 2), Detected Anomalies (Channel 1). Axes object 2 with title Anomaly Scores, xlabel Window Start Index, ylabel Score contains 3 objects of type stem, line, constantline. One or more of the lines displays its values using only markers These objects represent Anomaly Scores, Detected Anomalies.

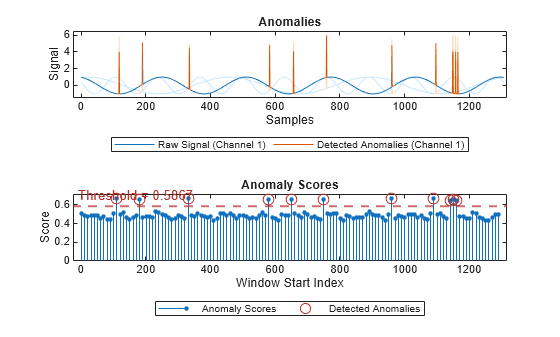
The top plot shows an overlay of red where the anomalies occur. The bottom plot shows how effective the threshold is at dividing the normal from the abnormal scores for Signal set 3.

Input Arguments

collapse all

Number of input channels in each time series, specified as a positive integer. All time series inputs must have the same number of channels.

Name-Value Arguments

expand all

Specify optional pairs of arguments as Name1=Value1,...,NameN=ValueN, where Name is the argument name and Value is the corresponding value. Name-value arguments must appear after other arguments, but the order of the pairs does not matter.

Example: detector = timeSeriesIforestAD(3,DetectionWindowLength=20) sets the length of the detection window to 20.

Window

expand all

Window length of each time series segment, specified as a positive integer.

Stride length of sliding window in training stage, specified as a positive integer.

Stride length of sliding window in detection stage, specified as a positive integer. DetectionStride controls the number of overlapped samples. Increasing the amount of overlap provides higher resolution, but at higher computational cost.

If you do not specify DetectionStride, the software sets the stride length to the value of WindowLength to create non-overlapping windows.

Feature Extraction

expand all

Enable feature extraction option, specified as 1(true) or 0(false).

  • When FeatureExtraction is enabled, the software extracts statistical features to use during training. Extracted features are generally cleaner and more meaningful than raw data, but the extraction process can be computationally expensive.

  • When FeatureExtraction is disabled, the training process uses only raw data. Raw data is likely to be noisier and include random disturbances. However, if you have a relatively small number of signals and they already represent useful features, then the computational cost FeatureExtraction may not be worth the benefit.

Threshold

expand all

Method to compute the detection threshold, specified as one of these values, each of which correspond to what the detection threshold is based on:

  • "kSigma" — Standard deviation of the normalized anomaly scores. The parameter k determines the threshold within the standard deviation levels that identifies an anomaly. The value of k is specified by ThresholdParameter.

  • "contaminationFraction" — Percentage of anomalies within a specified fraction of windows, measured over the entire training set. The fraction value is specified by ThresholdParameter.

  • "max" — Maximum window loss measured over the entire training data set and multiplied by ThresholdParameter

  • "mean" — Mean window loss measured over the entire training data set and multiplied by ThresholdParameter

  • "median" — Median window loss measured over the entire training data set and multiplied by ThresholdParameter

  • "manual" — Manual detection threshold value based on Threshold.

  • "customFunction" — Custom detection threshold method based on ThresholdFunction.

If you specify ThresholdMethod, you can also specify ThresholdParameter, Threshold, or ThresholdParameter. The available threshold parameter depends on the specified detection method.

Anomaly score used to detect anomalies, specified as a positive scalar. The source of the Threshold value depends on the setting of ThresholdMethod.

  • If ThresholdMethod is "manual", you set the value.

  • If ThresholdMethod is "customFunction", the function specified in ThresholdFunction computes the value.

  • For other values of ThresholdMethod, use ThresholdParameter to specify the detection threshold.

Parameter used for determining the detection threshold, specified as a numeric scalar.

The way you specify ThresholdParameter depends on the specified value for ThresholdMethod. The following list describes the specification of ThresholdParameter for each possible value of ThresholdMethod

  • "kSigma" — Specify ThresholdParameter as a positive numeric scalar. If you do not specify ThresholdParameter, the detector sets the threshold to 3.

  • "contaminationFraction"— Specify ThresholdParameter as a as a nonnegative scalar less than 0.5. For example, if you specify "contaminationFraction" as 0.05, then the threshold is set to identify the top 5% of the anomaly scores as anomalous. If you do not specify ThresholdParameter, the detector sets the threshold to 0.01.

  • "max", "mean", or "median" — Specify ThresholdParameter as a positive numeric scalar. If you do not specify ThresholdParameter, the detector sets the threshold to 1.

  • "customFunction" or "manual"ThresholdParameter does not apply.

Function to compute custom detection threshold, specified as a function handle. This argument applies only when ThresholdMethod is specified as "customFunction".

  • The input to the function must be the vector of the anomaly scores.

  • The function must return a positive scalar corresponding to the detection threshold.

Isolation Forest Model Options

expand all

Number of trees in the isolation forest, specified as a positive integer.

The average path lengths used by the isolation forest algorithm to compute anomaly scores usually converge well before growing 100 isolation trees for both normal points and anomalies.

Number of observations to draw from the training data, without replacement, for each isolation tree, specified as a positive integer greater than or equal to 3.

The isolation forest algorithm performs well with a small value for NumObservationsPerLearner, because using a small sample size helps to detect dense anomalies and anomalies close to normal points. However, you need to experiment with the sample size if N, the number of training observations, is small.

Normalization

expand all

Normalization technique for training and testing, specified as "zscore", "range", or "off".

  • "range" — Rescale the data range to [0,1].

  • "zscore" — Distance from a data point to the mean in terms of standard deviation

  • "off" — Do not normalize the data.

For more information on normalization methods, see normalize.

Output Arguments

collapse all

Anomaly detector model, returned as an TimeSeriesIForestDetector object.

Version History

Introduced in R2026a