IMU 測定のシミュレーションの概要
この例では、imuSensor System object™ を使用して慣性計測ユニット (IMU) 測定をシミュレートする方法を示します。IMU には、ジャイロスコープ、加速度計、磁力計を含む個々のセンサーの組み合わせを含むことができます。gyroparams、accelparams、および magparams をそれぞれ使用して個々のセンサーのプロパティを指定できます。
以下のプロットでは、特に指定のない限り、"x" 軸の測定のみ表示されます。スライダーを使用して、パラメーターを対話的に調整します。
既定のパラメーター
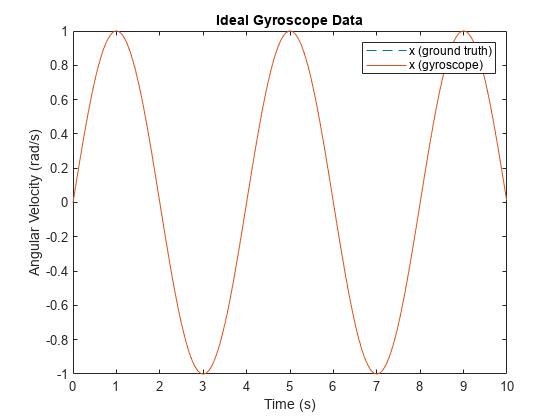
ジャイロスコープ モデルの既定のパラメーターは理想的な信号をシミュレーションします。正弦波入力を与えた場合、ジャイロスコープ出力は厳密に一致しなければなりません。
params = gyroparams
params =
  gyroparams with properties:

    MeasurementRange: Inf             rad/s
          Resolution: 0               (rad/s)/LSB
        ConstantBias: [0 0 0]         rad/s
    AxesMisalignment: [3⨯3 double]    %

                   NoiseDensity: [0 0 0]           (rad/s)/√Hz
                BiasInstability: [0 0 0]           rad/s
                     RandomWalk: [0 0 0]           (rad/s)*√Hz
                      NoiseType: "double-sided"
    BiasInstabilityCoefficients: [1⨯1 struct]

           TemperatureBias: [0 0 0]    (rad/s)/°C
    TemperatureScaleFactor: [0 0 0]    %/°C
          AccelerationBias: [0 0 0]    (rad/s)/(m/s²)
% Generate N samples at a sampling rate of Fs with a sinusoidal frequency
% of Fc.
N = 1000;
Fs = 100;
Fc = 0.25;

t = (0:(1/Fs):((N-1)/Fs)).';
acc = zeros(N, 3);
angvel = zeros(N, 3);
angvel(:,1) = sin(2*pi*Fc*t);

imu = imuSensor('SampleRate', Fs, 'Gyroscope', params);
[~, gyroData] = imu(acc, angvel);

figure
plot(t, angvel(:,1), '--', t, gyroData(:,1))
xlabel('Time (s)')
ylabel('Angular Velocity (rad/s)')
title('Ideal Gyroscope Data')
legend('x (ground truth)', 'x (gyroscope)')
ハードウェア パラメーターの調整
以下のパラメーターは、ハードウェアの制限または欠陥をモデル化します。一部のパラメーターはキャリブレーションを通じて修正できます。
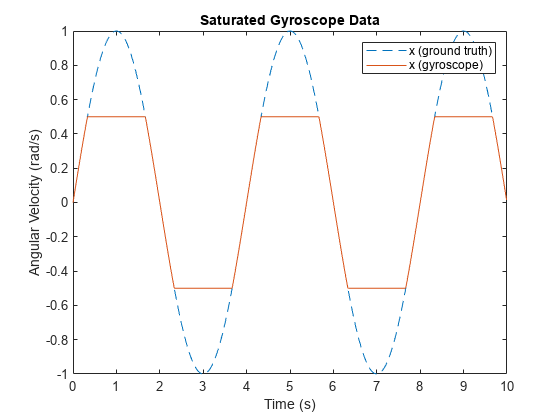
MeasurementRange は、ジャイロスコープでレポートされる最大絶対値を決定します。絶対値が大きい方が飽和されます。その効果は、測定範囲を正弦波グラウンド トゥルース角速度の振幅より小さい値に設定することで示されます。
imu = imuSensor('SampleRate', Fs, 'Gyroscope', params); imu.Gyroscope.MeasurementRange =0.5; % rad/s [~, gyroData] = imu(acc, angvel); figure plot(t, angvel(:,1), '--', t, gyroData(:,1)) xlabel('Time (s)') ylabel('Angular Velocity (rad/s)') title('Saturated Gyroscope Data') legend('x (ground truth)', 'x (gyroscope)')
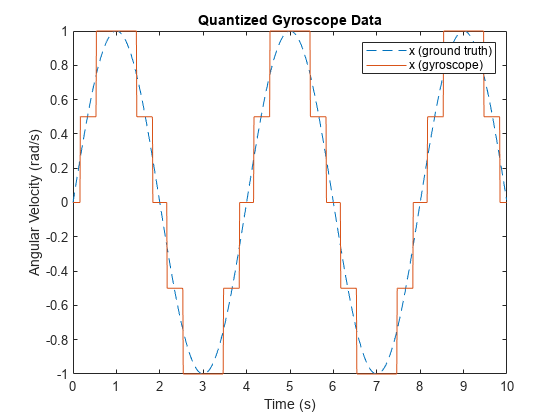
Resolution は、デジタル測定のステップ サイズに影響します。このパラメーターを使用して、アナログ デジタル コンバーター (ADC) からの量子化の影響をモデル化します。その効果は、パラメーターを通常よりも大幅に大きい値に増やすことで示されます。
imu = imuSensor('SampleRate', Fs, 'Gyroscope', params); imu.Gyroscope.Resolution =0.5; % (rad/s)/LSB [~, gyroData] = imu(acc, angvel); figure plot(t, angvel(:,1), '--', t, gyroData(:,1)) xlabel('Time (s)') ylabel('Angular Velocity (rad/s)') title('Quantized Gyroscope Data') legend('x (ground truth)', 'x (gyroscope)')
AxesMisalignment はセンサーの座標軸のせん断の量です。通常、このせん断はセンサーが PCB に取り付けられている場合に行われ、キャリブレーションを通じて修正できます。その効果は、"x" 軸をわずかに歪め、"x" 軸と "y" 軸の両方をプロットすることで示されます。
imu = imuSensor('SampleRate', Fs, 'Gyroscope', params); xMisalignment =2; % percent imu.Gyroscope.AxesMisalignment = [xMisalignment, 0, 0]; % percent [~, gyroData] = imu(acc, angvel); figure plot(t, angvel(:,1:2), '--', t, gyroData(:,1:2)) xlabel('Time (s)') ylabel('Angular Velocity (rad/s)') title('Misaligned Gyroscope Data') legend('x (ground truth)', 'y (ground truth)', ... 'x (gyroscope)', 'y (gyroscope)')

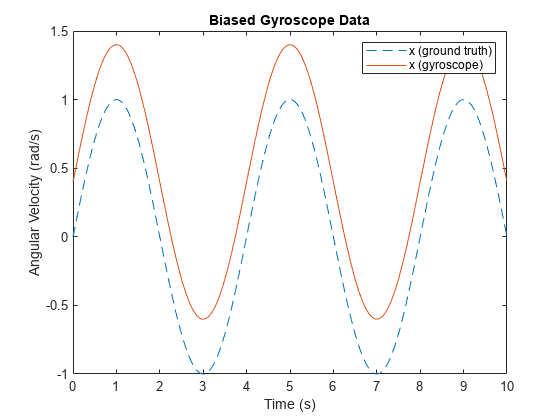
ConstantBias は、ハードウェアの欠陥によりセンサー測定に出現します。このバイアスは、温度などの環境要因が原因ではないため、キャリブレーションを通じて修正できます。
imu = imuSensor('SampleRate', Fs, 'Gyroscope', params); xBias =0.4; % rad/s imu.Gyroscope.ConstantBias = [xBias, 0, 0]; % rad/s [~, gyroData] = imu(acc, angvel); figure plot(t, angvel(:,1), '--', t, gyroData(:,1)) xlabel('Time (s)') ylabel('Angular Velocity (rad/s)') title('Biased Gyroscope Data') legend('x (ground truth)', 'x (gyroscope)')
ランダム ノイズ パラメーターの調整
以下のパラメーターは、センサー測定のランダム ノイズをモデル化します。これらのパラメーターの詳細については、アラン分散を使用した慣性センサーのノイズ解析 (Sensor Fusion and Tracking Toolbox)の例を参照してください。
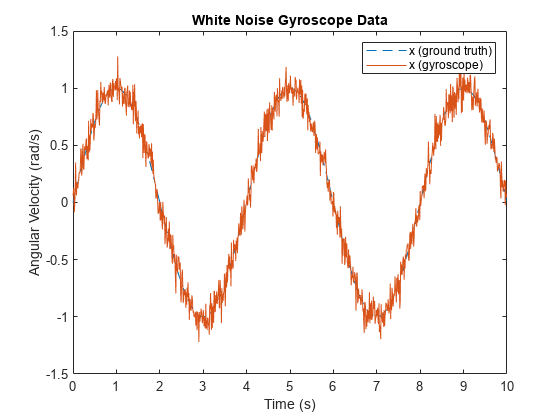
NoiseDensity はセンサー測定のホワイト ノイズの量です。これは、ジャイロスコープでは角度のランダム ウォーク、加速度計では速度のランダムウォークと呼ばれることもあります。
rng('default') imu = imuSensor('SampleRate', Fs, 'Gyroscope', params); imu.Gyroscope.NoiseDensity =0.0125; % (rad/s)/sqrt(Hz) [~, gyroData] = imu(acc, angvel); figure plot(t, angvel(:,1), '--', t, gyroData(:,1)) xlabel('Time (s)') ylabel('Angular Velocity (rad/s)') title('White Noise Gyroscope Data') legend('x (ground truth)', 'x (gyroscope)')
BiasInstability はセンサー測定のピンク ノイズまたはフリッカー ノイズの量です。
imu = imuSensor('SampleRate', Fs, 'Gyroscope', params); imu.Gyroscope.BiasInstability =0.02; % rad/s [~, gyroData] = imu(acc, angvel); figure plot(t, angvel(:,1), '--', t, gyroData(:,1)) xlabel('Time (s)') ylabel('Angular Velocity (rad/s)') title('Bias Instability Gyroscope Data') legend('x (ground truth)', 'x (gyroscope)')

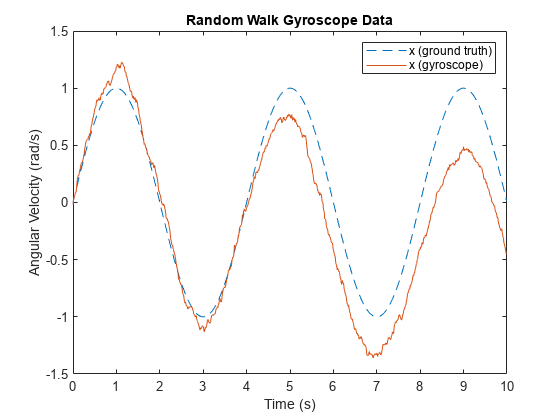
RandomWalk はセンサー測定のブラウン ノイズの量です。これは、ジャイロスコープではレートのランダム ウォーク、加速度計では加速度のランダム ウォークと呼ばれることもあります。
imu = imuSensor('SampleRate', Fs, 'Gyroscope', params); imu.Gyroscope.RandomWalk =0.091; % (rad/s)*sqrt(Hz) [~, gyroData] = imu(acc, angvel); figure plot(t, angvel(:,1), '--', t, gyroData(:,1)) xlabel('Time (s)') ylabel('Angular Velocity (rad/s)') title('Random Walk Gyroscope Data') legend('x (ground truth)', 'x (gyroscope)')
環境パラメーターの調整
以下のパラメーターは、センサーの環境の変化により生じたノイズをモデル化します。
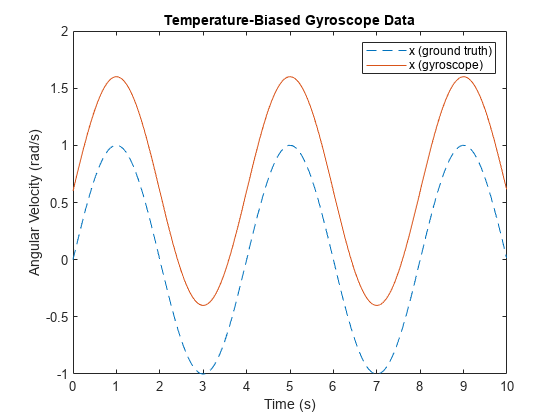
TemperatureBias は、既定の動作温度との温度差によりセンサー測定に追加されるバイアスです。ほとんどのセンサー データシートでは、既定の動作温度が摂氏 25 度としてリストされます。このバイアスは、パラメーターを非ゼロ値に設定し、動作温度を摂氏 25 度を超える値に設定することで示されます。
imu = imuSensor('SampleRate', Fs, 'Gyroscope', params); imu.Gyroscope.TemperatureBias =0.06; % (rad/s)/(degrees C) imu.Temperature = 35; [~, gyroData] = imu(acc, angvel); figure plot(t, angvel(:,1), '--', t, gyroData(:,1)) xlabel('Time (s)') ylabel('Angular Velocity (rad/s)') title('Temperature-Biased Gyroscope Data') legend('x (ground truth)', 'x (gyroscope)')
TemperatureScaleFactor は、動作温度の変化によるセンサーのスケール係数の誤差です。これにより測定のスケーリングで誤差が生じます。つまり、理想値が小さい方が大きい値よりも誤差が少なくなります。この誤差は、温度を線形的に上げることで示されます。
imu = imuSensor('SampleRate', Fs, 'Gyroscope', params); imu.Gyroscope.TemperatureScaleFactor =3.2; % %/(degrees C) standardTemperature = 25; % degrees C temperatureSlope = 2; % (degrees C)/s temperature = temperatureSlope*t + standardTemperature; gyroData = zeros(N, 3); for i = 1:N imu.Temperature = temperature(i); [~, gyroData(i,:)] = imu(acc(i,:), angvel(i,:)); end figure plot(t, angvel(:,1), '--', t, gyroData(:,1)) xlabel('Time (s)') ylabel('Angular Velocity (rad/s)') title('Temperature-Scaled Gyroscope Data') legend('x (ground truth)', 'x (gyroscope)')

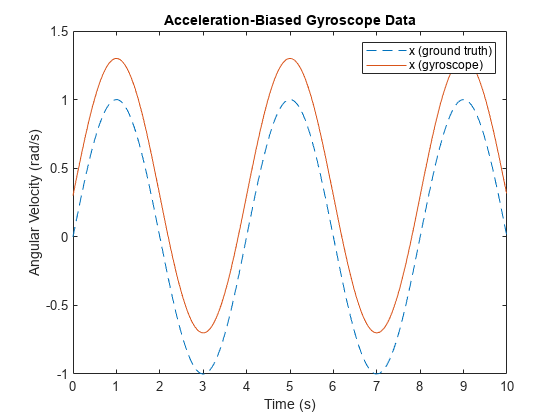
AccelerationBias は、線形加速度によりジャイロスコープ測定に追加されるバイアスです。このパラメーターはジャイロスコープに固有です。このバイアスは、パラメーターを非ゼロ値に設定し、非ゼロの入力加速度を使用することで示されます。
imu = imuSensor('SampleRate', Fs, 'Gyroscope', params); imu.Gyroscope.AccelerationBias =0.3; % (rad/s)/(m/s^2) acc(:,1) = 1; [~, gyroData] = imu(acc, angvel); figure plot(t, angvel(:,1), '--', t, gyroData(:,1)) xlabel('Time (s)') ylabel('Angular Velocity (rad/s)') title('Acceleration-Biased Gyroscope Data') legend('x (ground truth)', 'x (gyroscope)')
