Main Content

show

Plot and visualize A* explored nodes and planned path

Since R2020b

    Description

    example

    show(planner) plots and visualizes the A* explored nodes and the planned path in the associated map.

    axHandle = show(planner) returns the axes handle of the figure used to plot the path.

    [___] = show(___,Name,Value) specifies options using one or more name-value pair arguments in addition to any of the arguments from previous syntaxes. Enclose argument name inside single quotes (' ').

    For example, 'ExploredNodes','off' plots and visualizes the planned path without displaying the explored nodes.

    Examples

    collapse all

    Plan the shortest collision-free path through an obstacle grid map using the A* path planning algorithm.

    Generate a binaryOccupancyMap object with randomly scattered obstacles using the mapClutter function.

    rng('default');
    map = mapClutter;

    Use the map to create a plannerAStarGrid object.

    planner = plannerAStarGrid(map);

    Define the start and goal points.

    start = [2 3];
    goal = [248 248];

    Plan a path from the start point to the goal point.

    plan(planner,start,goal);

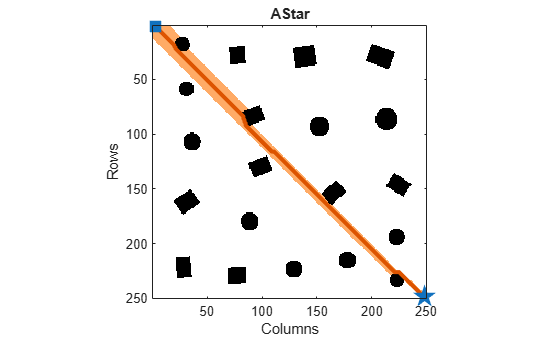
    Visualize the path and the explored nodes using the show object function.

    show(planner)

    Input Arguments

    collapse all

    A* path planner for a grid map, specified as a plannerAStarGrid object.

    Name-Value Arguments

    Specify optional pairs of arguments as Name1=Value1,...,NameN=ValueN, where Name is the argument name and Value is the corresponding value. Name-value arguments must appear after other arguments, but the order of the pairs does not matter.

    Before R2021a, use commas to separate each name and value, and enclose Name in quotes.

    Example: 'ExploredNodes','off' plots and visualizes the planned path without displaying the explored nodes.

    Axes used to plot path, specified as the comma-separated pair consisting of 'Parent' and either an Axes Properties or UIAxes Properties object. If you do not specify Parent, a new figure is created.

    Example: 'Parent',axHandle

    Display the explored nodes, specified as the comma-separated pair consisting of 'ExploredNodes' and either 'on' or 'off'.

    Example: 'ExploredNodes','off'

    Data Types: string | char

    Output Arguments

    collapse all

    Axes used to plot the path, returned as an Axes Properties or UIAxes Properties object.

    Version History

    Introduced in R2020b