show
Display 2-D occupancy map
Description
show( displays the occupancy
grid map)map in the current axes, with the axes labels
representing the world coordinates.
show( displays the
occupancy grid map,'local')map in the current axes, with the axes
labels representing the local coordinates instead of world coordinates.
show( displays the
occupancy grid map,'grid')map in the current axes, with the axes
labels representing the grid coordinates.
show(___,
specifies additional options specified by one or more name-value pair
arguments.Name,Value)
mapImage = show(___)show.
Examples
Create an empty map of 10-by-10 meters in size.
map = occupancyMap(10,10,10);
Update the occupancy of specific world locations with new probability values and display the map.
x = [1.2; 2.3; 3.4; 4.5; 5.6];
y = [5.0; 4.0; 3.0; 2.0; 1.0];

pvalues = [0.2; 0.4; 0.6; 0.8; 1];

updateOccupancy(map,[x y],pvalues)
figure
show(map)
![Figure contains an axes object. The axes object with title Occupancy Grid, xlabel X [meters], ylabel Y [meters] contains an object of type image.](../../examples/nav/win64/CreateAndModifyAnOccupancyMapExample_01.png)
Inflate the occupied areas by a radius of 0.5 m. The larger occupancy values overwrite the smaller values.
inflate(map,0.5)
figure
show(map)
![Figure contains an axes object. The axes object with title Occupancy Grid, xlabel X [meters], ylabel Y [meters] contains an object of type image.](../../examples/nav/win64/CreateAndModifyAnOccupancyMapExample_02.png)
Get the grid locations from the world locations.
ij = world2grid(map,[x y]);
Set occupancy values for the grid locations.
setOccupancy(map,ij,ones(5,1),'grid')
figure
show(map)![Figure contains an axes object. The axes object with title Occupancy Grid, xlabel X [meters], ylabel Y [meters] contains an object of type image.](../../examples/nav/win64/CreateAndModifyAnOccupancyMapExample_03.png)
Convert a portable graymap (PGM) file containing a ROS map into an occupancyMap for use in MATLAB®.
Import the image using imread. Crop the image to the playpen area.
image = imread('playpen_map.pgm');
imageCropped = image(750:1250,750:1250);
imshow(imageCropped)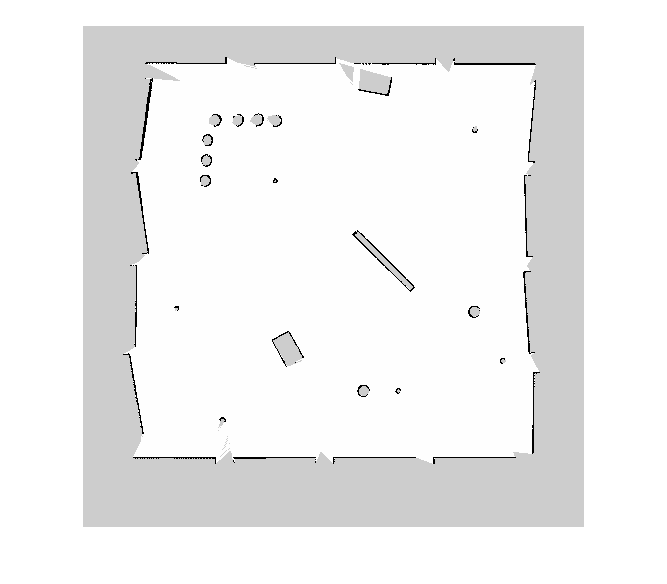
PGM values are expressed from 0 to 255 as uint8. Normalize these values by converting the cropped image to double and dividing each cell by 255. This image shows obstacles as values close to 0. Subtract the normalized image from 1 to get occupancy values with 1 representing occupied space.
imageNorm = double(imageCropped)/255;
imageOccupancy = 1 - imageNorm;
Create the occupancyMap object using an adjusted map image. The imported map resolution is 20 cells per meter.
map = occupancyMap(imageOccupancy,20);
show(map)
![Figure contains an axes object. The axes object with title Occupancy Grid, xlabel X [meters], ylabel Y [meters] contains an object of type image.](../../examples/nav/win64/ConvertPGMImageToMapExample_02.png)
Input Arguments
Name-Value Arguments
Outputs
Version History
Introduced in R2019b