lidarScan
2 次元 LiDAR スキャンを保存するためのオブジェクトの作成
説明
lidarScan オブジェクトには、単一の 2 次元 LiDAR (光検出と測距) スキャンのデータが含まれています。LiDAR スキャンは、特定の角度 (Angles) で測定した環境内のセンサーから障害物までの距離 (Ranges) をもつ 2 次元平面用のレーザー スキャンです。このレーザー スキャン オブジェクトを、matchScans、controllerVFH、monteCarloLocalization など、他のロボティクス アルゴリズムへの入力として使用します。
作成
説明
scan = lidarScan(ranges,angles)ranges と angles から lidarScan オブジェクトを作成します。ranges 入力と angles 入力は同じ長さのベクトルであり、Ranges プロパティおよび Angles プロパティに直接設定されます。
scan = lidarScan(cart)lidarScan オブジェクトを作成します。Cartesian プロパティはこの入力から直接設定されます。
scan = lidarScan(scanMsg)LaserScan (ROS Toolbox) ROS メッセージ オブジェクトから lidarScan オブジェクトを作成します。
プロパティ
オブジェクト関数
plot | レーザーまたは LiDAR スキャンの読み取り値の表示 |
removeInvalidData | Remove invalid range and angle data |
transformScan | Transform laser scan based on relative pose |
例
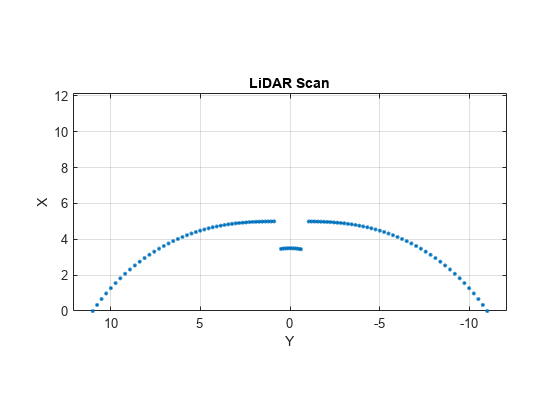
LiDAR データを距離と角度のベクトルとして指定します。これらの値には、センサーの範囲外の読み取り値が含まれます。
x = linspace(-2,2);
ranges = abs((1.5).*x.^2 + 5);
ranges(45:55) = 3.5;
angles = linspace(-pi/2,pi/2,numel(ranges));
距離と角度を指定することにより、LiDAR スキャンを作成します。LiDAR スキャンのすべての点をプロットします。
scan = lidarScan(ranges,angles);
plot(scan)
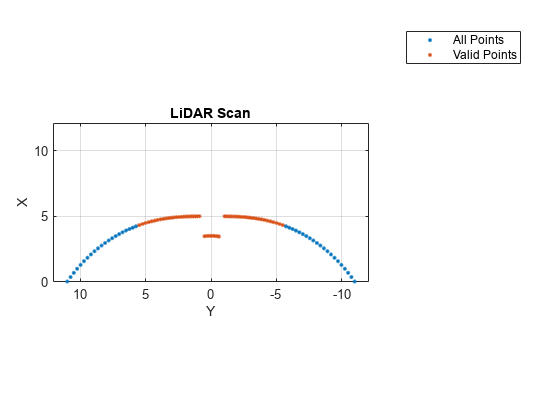
指定した最小/最大距離に基づいて、無効な点を削除します。
minRange = 0.1;
maxRange = 7;
scan2 = removeInvalidData(scan,'RangeLimits',[minRange maxRange]);
hold on
plot(scan2)
legend('All Points','Valid Points')
lidarScan オブジェクトを作成します。距離と角度をベクトルとして指定します。
refRanges = 5*ones(1,300);
refAngles = linspace(-pi/2,pi/2,300);
refScan = lidarScan(refRanges,refAngles);
[x y] を (0.5,0.2) だけオフセットしてレーザー スキャンを平行移動します。
transformedScan = transformScan(refScan,[0.5 0.2 0]);
レーザー スキャンを 20 度回転します。
rotateScan = transformScan(refScan,[0,0,deg2rad(20)]);
lidarScan (Robotics System Toolbox)を使用して、基準 LiDAR スキャンを作成します。距離と角度をベクトルとして指定します。
refRanges = 5*ones(1,300);
refAngles = linspace(-pi/2,pi/2,300);
refScan = lidarScan(refRanges,refAngles);
関数transformScan (Robotics System Toolbox)を使用して、x,y オフセット (0.5,0.2) で 2 番目の LiDAR スキャンを生成します。
currScan = transformScan(refScan,[0.5 0.2 0]);
基準スキャンと 2 番目のスキャンを照合して、それらの間の姿勢の誤差を推定します。
pose = matchScans(currScan,refScan);
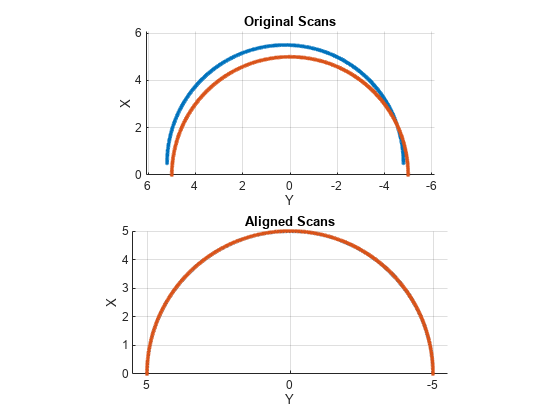
関数 transformScan を使用し、相対姿勢の誤差を使用して 2 番目のスキャンを最初のスキャンの座標系に変換することにより、スキャンを調整します。元のスキャンと調整されたスキャンの両方をプロットします。
currScan2 = transformScan(currScan,pose);

subplot(2,1,1);
hold on
plot(currScan)
plot(refScan)
title('Original Scans')
hold off

subplot(2,1,2);
hold on
plot(currScan2)
plot(refScan)
title('Aligned Scans')
xlim([0 5])
hold off
拡張機能
バージョン履歴
R2019b で導入