rgbplot
カラーマップのプロット
説明
例
parula カラーマップをプロットし、カラー バーを視覚的参照として表示します。
rgbplot(parula)
hold on
colormap(parula)
colorbar('Ticks',[])

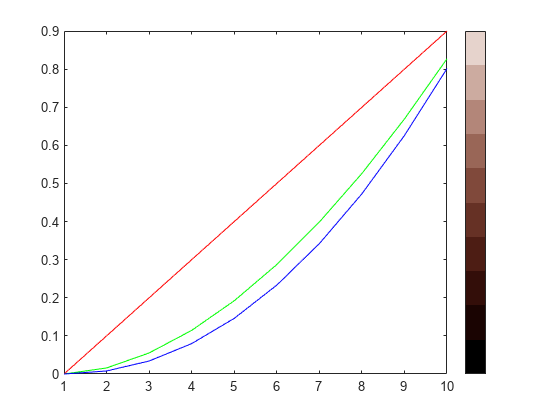
カスタム カラーマップを作成してプロットします。その後、カラー バーを視覚的参照として表示します。
r = (0:.1:.9)';
g = r.^1.8;
b = r.^2.1;
mymap = [r g b];
rgbplot(mymap)
hold on
colormap(mymap)
colorbar('Ticks',[])

入力引数
プロットするカラーマップ。RGB 3 成分からなる 3 列の行列として指定します。RGB 3 成分は、各要素が色の赤、緑、青の成分の強度を指定する 3 要素の行ベクトルです。強度値は [0, 1] の範囲でなければなりません。次に 5 色を含むカラーマップの例を示します。
map = [0.2 0.1 0.5
    0.1 0.5 0.8
    0.2 0.7 0.6
    0.8 0.7 0.3
    0.9 1 0];
次の表に一般的な色に対応する RGB 3 成分の値を示します。
| 色 | RGB 3 成分 |
|---|---|
| 黄 | [1 1 0] |
| マゼンタ | [1 0 1] |
| シアン | [0 1 1] |
| 赤 | [1 0 0] |
| 緑 | [0 1 0] |
| 青 | [0 0 1] |
| 白 | [1 1 1] |
| 黒 | [0 0 0] |
あるいは、事前定義されたカラーマップ関数のいずれかを呼び出して、行列を作成することもできます。この関数を関数 rgbplot の入力引数として呼び出します。たとえば、次のコマンドは parula カラーマップをプロットします。
rgbplot(parula)
データ型: double | single
バージョン履歴
R2006a より前に導入
参考
MATLAB Command
You clicked a link that corresponds to this MATLAB command:
Run the command by entering it in the MATLAB Command Window. Web browsers do not support MATLAB commands.
Web サイトの選択
Web サイトを選択すると、翻訳されたコンテンツにアクセスし、地域のイベントやサービスを確認できます。現在の位置情報に基づき、次のサイトの選択を推奨します:
また、以下のリストから Web サイトを選択することもできます。
最適なサイトパフォーマンスの取得方法
中国のサイト (中国語または英語) を選択することで、最適なサイトパフォーマンスが得られます。その他の国の MathWorks のサイトは、お客様の地域からのアクセスが最適化されていません。
南北アメリカ
- América Latina (Español)
- Canada (English)
- United States (English)
ヨーロッパ
- Belgium (English)
- Denmark (English)
- Deutschland (Deutsch)
- España (Español)
- Finland (English)
- France (Français)
- Ireland (English)
- Italia (Italiano)
- Luxembourg (English)
- Netherlands (English)
- Norway (English)
- Österreich (Deutsch)
- Portugal (English)
- Sweden (English)
- Switzerland
- United Kingdom (English)