このページは前リリースの情報です。該当の英語のページはこのリリースで削除されています。
主題図
コロプレス、分類、バブル、散布、等高線、ステム マップ上の属性データを伝達します。
主題図は、場所や特徴の属性を表します。たとえば、choropleth mapを使用して州別の選挙結果を表示したり、等高線図を使用してさまざまな標高での航空機の視認性を表示したり、バブル チャートを使用してさまざまな都市の人口を表示したりできます。
関数
トピック
- Create Choropleth Map of Population Density
Create a choropleth map of US population density, where the color of each state represents the population density of the state.
注目の例
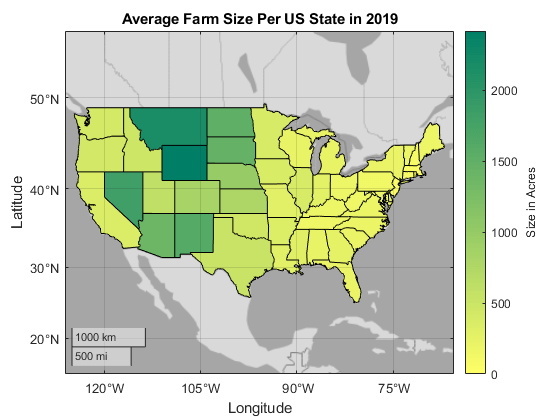
Create Choropleth Map from Table Data
Create a map that illustrates numeric attributes using colors along a gradient.
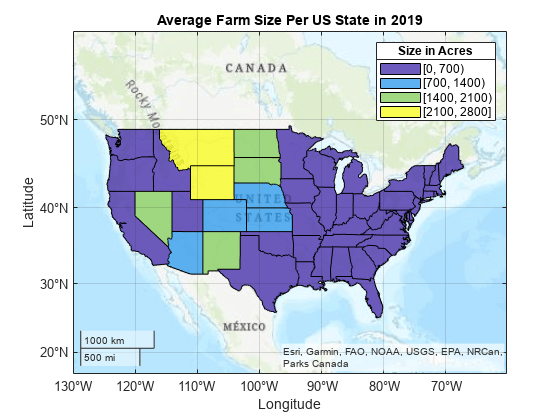
Create Classification Map from Table Data
Create a map that illustrates categorical attributes using discrete colors.