Main Content

readEcostressSig

Read data from ECOSTRESS spectral library

Since R2020a

Description

example

libData = readEcostressSig(filenames) reads spectral data from the specified ECOSTRESS spectrum files.

The function supports only ECOSTRESS spectrum files. All inputs must be text files with suffix spectrum.txt.

example

libData = readEcostressSig(dirname) reads spectral data from the ECOSTRESS spectrum files stored in the specified directory.

example

libData = readEcostressSig(dirname,keyword) reads spectral data from only those ECOSTRESS spectrum files stored in the specified directory with the specified keyword in their file names.

Note

This function requires the Image Processing Toolbox™ Hyperspectral Imaging Library. You can install the Image Processing Toolbox Hyperspectral Imaging Library from Add-On Explorer. For more information about installing add-ons, see Get and Manage Add-Ons.

The Image Processing Toolbox Hyperspectral Imaging Library requires desktop MATLAB®, as MATLAB Online™ or MATLAB Mobile™ do not support the library.

Examples

collapse all

Specify the names of the spectrum files to read from the ECOSTRESS spectral library as a cell array of character vectors.

ecostressfiles = [{'soil.utisol.hapludult.none.all.87p707.jhu.becknic.spectrum.txt'},...
             {'water.seawater.none.liquid.tir.seafoam.jhu.becknic.spectrum.txt'},...
             {'vegetation.tree.eucalyptus.maculata.vswir.jpl087.jpl.asd.spectrum.txt'},...
             {'manmade.road.tar.solid.all.0099uuutar.jhu.becknic.spectrum.txt'}];

Read and display the data from the specified ECOSTRESS spectrum files. The function returns a structure array with a row for each specified ECOSTRESS spectrum file. Each row stores the spectral data read from the associated file.

libData = readEcostressSig(ecostressfiles)
libData=1×4 struct array with fields:
    Name
    Type
    Class
    SubClass
    ParticleSize
    Genus
    Species
    SampleNo
    Owner
    WavelengthRange
    Origin
    CollectionDate
    Description
    Measurement
    FirstColumn
    SecondColumn
    WavelengthUnit
    DataUnit
    FirstXValue
    LastXValue
    NumberOfXValues
    AdditionalInformation
    Wavelength
    Reflectance
      ⋮

Extract the details of the spectral data of the second file from the structure array.

libData(2)
ans = struct with fields:
                     Name: "Sea Foam"
                     Type: "Water"
                    Class: "Sea Water"
                 SubClass: "none"
             ParticleSize: "Liquid"
                    Genus: [0x0 string]
                  Species: [0x0 string]
                 SampleNo: "seafoam"
                    Owner: "Dept. of Earth and Planetary Science, John Hopkins University"
          WavelengthRange: "TIR"
                   Origin: "JHU IR Spectroscopy Lab."
           CollectionDate: "N/A"
              Description: "Sea foam water. Original filename FOAM Original ASTER Spectral Library name was jhu.becknic.water.sea.none.liquid.seafoam.spectrum.txt"
              Measurement: "Directional (10 Degree) Hemispherical Reflectance"
              FirstColumn: "X"
             SecondColumn: "Y"
           WavelengthUnit: "micrometer"
                 DataUnit: "Reflectance (percent)"
              FirstXValue: "14.0112"
               LastXValue: "2.0795"
          NumberOfXValues: "2110"
    AdditionalInformation: "none"
               Wavelength: [2110x1 double]
              Reflectance: [2110x1 double]

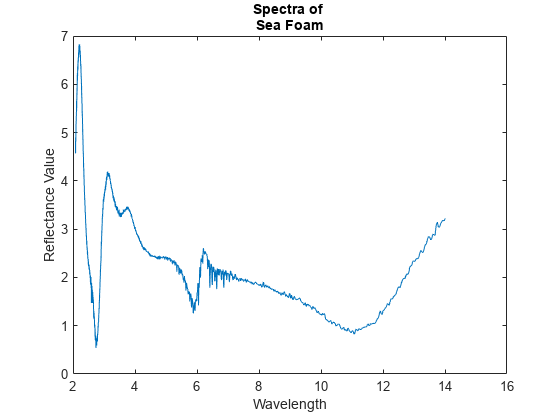
Extract the reflectance and the wavelength values from the spectral data of the second file.

reflectance = libData(2).Reflectance;
wavelength = libData(2).Wavelength;

Plot the spectral signature using the wavelength and reflectance values.

figure
plot(wavelength,reflectance)
title(['Spectra of ' libData(2).Name])
xlabel('Wavelength')
ylabel('Reflectance Value')

Figure contains an axes object. The axes object with title Spectra of Sea Foam, xlabel Wavelength, ylabel Reflectance Value contains an object of type line.

Specify the full path of the directory that contains the ECOSTRESS spectrum files.

fileroot = matlabshared.supportpkg.getSupportPackageRoot();
dirname = fullfile(fileroot,'toolbox','images','supportpackages','hyperspectral','hyperdata','ECOSTRESSSpectraFiles');

Read and display the spectral data from all the files in the directory. The function returns a structure array with a row for each ECOSTRESS spectrum file in the specified directory.

libData = readEcostressSig(dirname)
libData=1×15 struct array with fields:
    Name
    Type
    Class
    SubClass
    ParticleSize
    Genus
    Species
    SampleNo
    Owner
    WavelengthRange
    Origin
    CollectionDate
    Description
    Measurement
    FirstColumn
    SecondColumn
    WavelengthUnit
    DataUnit
    FirstXValue
    LastXValue
    NumberOfXValues
    AdditionalInformation
    Wavelength
    Reflectance
      ⋮

Extract the details of the spectral data of the 15th file.

libData(15)
ans = struct with fields:
                     Name: "Tap water"
                     Type: "Water"
                    Class: "Tap Water"
                 SubClass: "none"
             ParticleSize: "Liquid"
                    Genus: [0×0 string]
                  Species: [0×0 string]
                 SampleNo: "tapwater"
                    Owner: "Dept. of Earth and Planetary Science, John Hopkins University"
          WavelengthRange: "All"
                   Origin: "JHU IR Spectroscopy Lab. Original filename TAPWATER."
           CollectionDate: "N/A"
              Description: "Tap water. Original ASTER Spectral Library name was jhu.becknic.water.tap.none.liquid.tapwater.spectrum.txt"
              Measurement: "Directional (10 Degree) Hemispherical Reflectance"
              FirstColumn: "X"
             SecondColumn: "Y"
           WavelengthUnit: "micrometer"
                 DataUnit: "Reflectance (percent)"
              FirstXValue: "14.0110"
               LastXValue: "0.4000"
          NumberOfXValues: "2844"
    AdditionalInformation: "none"
               Wavelength: [2844×1 double]
              Reflectance: [2844×1 double]

Specify full path of the directory that contains the ECOSTRESS spectrum files.

fileroot = matlabshared.supportpkg.getSupportPackageRoot();
dirname = fullfile(fileroot,'toolbox','images','supportpackages','hyperspectral','hyperdata','ECOSTRESSSpectraFiles');

Read and display the spectral data of the ECOSTRESS spectrum files with a specific keyword in their file names. The function returns a structure array with a row for each spectrum file in the specified directory with the keyword in their file names.

keyword = 'water';
libData = readEcostressSig(dirname,keyword)
libData=1×3 struct array with fields:
    Name
    Type
    Class
    SubClass
    ParticleSize
    Genus
    Species
    SampleNo
    Owner
    WavelengthRange
    Origin
    CollectionDate
    Description
    Measurement
    FirstColumn
    SecondColumn
    WavelengthUnit
    DataUnit
    FirstXValue
    LastXValue
    NumberOfXValues
    AdditionalInformation
    Wavelength
    Reflectance
      ⋮

Input Arguments

collapse all

Names of the ECOSTRESS files, specified as a character vector, string scalar, cell array of character vectors, or vector of strings. To read the data from multiple ECOSTRESS files simultaneously, use a cell array of character vectors or vector of strings. The function reads data from the files in the order in which you specify them. If the ECOSTRESS files are not in the current folder, you must specify the full path of each file.

Data Types: char | string

Name of the directory containing the ECOSTRESS files, specified as a character vector or string scalar. If the directory is not in the current folder, you must specify the full path of the directory.

Data Types: char | string

File search keyword, specified as a character vector or string scalar. The function returns data from only the ECOSTRESS spectrum files with the specified keyword in their file names. You cannot specify multiple keywords simultaneously.

Data Types: char | string

Output Arguments

collapse all

Spectral data from ECOSTRESS files, returned as a 1-by-K structure array. K is the number of spectrum files read by the function. Each element of the structure array has 24 fields that contain the header information of the spectrum files.

Field NamesDescription
NameName of the measured sample or material
TypeType of sample, such as "mineral", "rock", "tree", or "manmade"
Class

Class of the sample type

For example, if the sample type is "mineral" then the class can be: "native elements","silicates", "oxides", "sulfides", "sulfates", "halides", "carbonates", "phosphates", or "mineraloids".

SubClass

Subclass of the sample type

This field contains an empty array or "none", unless the Type value is "mineral", "rock", "manmade", "soil", "lunar", or "meteorite".

ParticleSize

Particle size of the sample type

This field contains an empty array unless the Type value is "mineral", "rock", "manmade", "soil", "lunar", or "meteorite".

Genus

Genus of the sample

This field contains an empty array unless the Type value is "vegetation" or "nonphotosynthetic".

Species

Species of the sample

This field contains an empty array unless the Type value is "vegetation" or "nonphotosynthetic".

SampleNo

Sample number

This value is an identifier for the associated sample.

OwnerOwner of the sample
WavelengthRange

Wavelength range of the measured sample

The value must be "All", "TIR", or "VSWIR".

OriginLocation from which the data was obtained
CollectionDate

Date on which the sample was collected

This value is in mm/dd/yy format.

Description

Description of the measured sample

This field provides additional information about the characteristics of the sample.

MeasurementSpectral measurement mode used to measure the sample
FirstColumnFirst column of data values in the spectrum file
SecondColumnSecond column of data values in the spectrum file
WavelengthUnit

Measuring unit for the spectral wavelengths of the samples

The value for every sample type is "micrometer". This field corresponds to the X Units field of the header data in the ECOSTRESS spectrum file.

DataUnit

Unit of the spectral measurement mode

Spectral measurement mode includes reflectance, transmittance, transittance, and transmission. The unit is percentage. This field corresponds to the Y Units field of the header data in the ECOSTRESS spectrum file.

FirstXValueFirst value in the first column of data values in the spectrum file
LastXValueLast value in the first column of data values in the spectrum file
NumberofXValuesTotal number of data values in the first column of the spectrum file
AdditionalInformation

Additional information about the sample

This field includes information that is not part of the spectral data.

WavelengthWavelength values at which the reflectances were measured
ReflectanceReflectance values measured at each wavelengths

References

[1] Meerdink, Susan K., Simon J. Hook, Dar A. Roberts, and Elsa A. Abbott. “The ECOSTRESS Spectral Library Version 1.0.” Remote Sensing of Environment 230 (September 2019): 111196. https://doi.org/10.1016/j.rse.2019.05.015.

[2] Download the ECOSTRESS Spectral Library: https://speclib.jpl.nasa.gov/download

Version History

Introduced in R2020a