Main Content

improfile

Pixel-value cross-sections along line segments

Description

Select Line Segments Interactively

c = improfile lets you select line segments interactively from the image in the current axes. When you finish selecting line segments, improfile returns sampled pixel values along the line segments in c.

With this syntax, you specify the line or path using the mouse, by clicking points in the image. Press Backspace or Delete to remove the previously selected point. To finish selecting points, adding a final point, press shift-click, right-click, or double-click. To finish selecting points without adding a final point, press Return.

c = improfile(n) returns n sampled pixel values from line segments that you select interactively.

Select Line Segments by Specifying Endpoints

c = improfile(I,xi,yi) returns sampled pixel values along line segments in image I. The endpoints of the line segments have (x, y) coordinates xi and yi.

c = improfile(xref,yref,I,xi,yi) returns pixel values in the world coordinate system defined by xref and yref. The line segment endpoints have (x, y) coordinates xi and yi in this coordinate system.

c = improfile(___,n) returns n sampled pixel values along the line segments.

Specify Interpolation Method or Output Options

c = improfile(___,method) specifies the interpolation method for pixel coordinates. Before the method input argument, you can specify the input arguments of any other syntax.

[cx,cy,c] = improfile(___) additionally returns the (x, y) coordinates of the sampled pixels, cx and cy. You can use the input arguments of any other syntax.

[cx,cy,c,xi2,yi2] = improfile(___) additionally returns the (x, y) coordinates of the line segment endpoints, xi and yi.

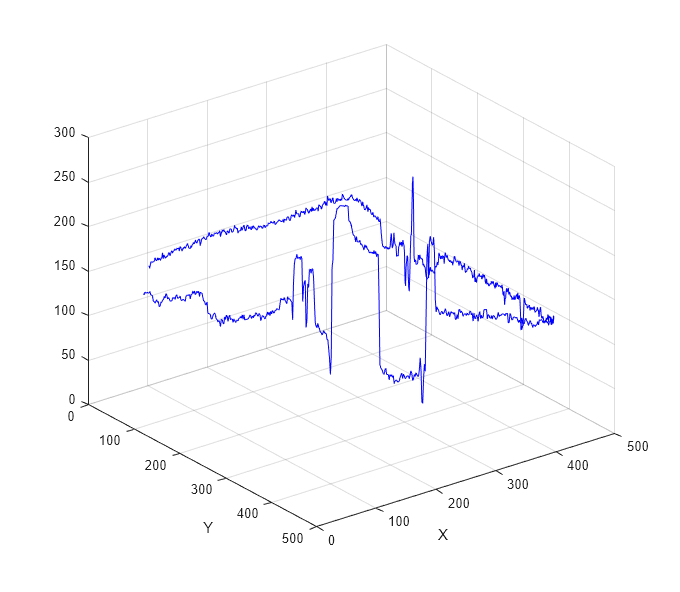
improfile(___) without output arguments displays a plot of pixel values along the line segments. If you select a single line segment, then improfile creates a two-dimensional plot of intensity values versus the distance along the line segment. Other syntaxes of improfile do not calculate the distance of sampled points along a line segment. If you select two or more line segments, then improfile creates a three-dimensional plot of the intensity values versus their x- and y-coordinates.

example

Examples

collapse all

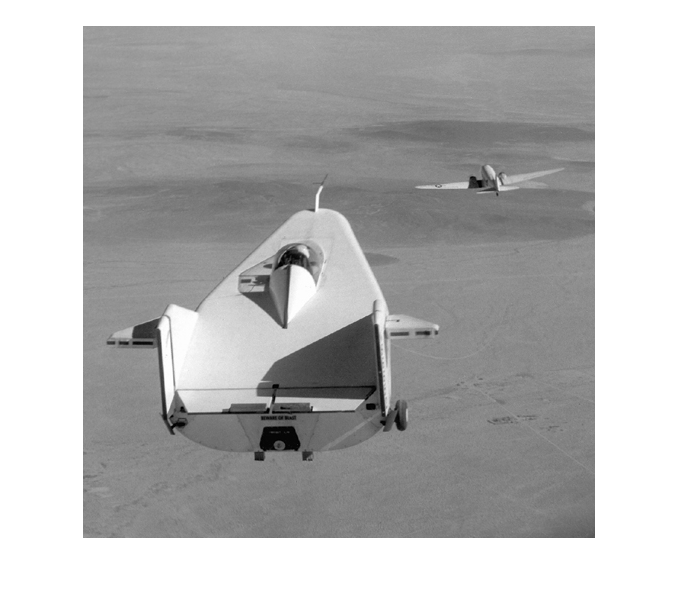
Read an image into the workspace, and display it.

I = imread('liftingbody.png');
imshow(I)

Figure contains an axes object. The hidden axes object contains an object of type image.

Specify x- and y-coordinates that define connected line segments.

x = [19 427 416 77];
y = [96 462 37 33];

Display a 3-D plot of the pixel values of these line segments.

improfile(I,x,y),grid on;

Figure contains an axes object. The axes object with xlabel X, ylabel Y contains an object of type line.

Input Arguments

collapse all

Number of points to along the path to sample, specified as a positive integer. If you do not provide this argument, then improfile chooses a value for n that is roughly equal to the number of pixels that the path traverses.

Data Types: double

Input image, specified as an RGB image, grayscale image, or binary image.

Data Types: single | double | int16 | uint8 | uint16 | logical

x-coordinate of line segment endpoints, specified as a numeric vector of the same length as yi. If you specify image limits in a world coordinate system using xref, then xi is in this coordinate system. Otherwise, xi is in the default spatial coordinate system.

Data Types: double

y-coordinate of line segment endpoints, specified as a numeric vector of the same length as xi. If you specify image limits in a world coordinate system using yref, then yi is in this coordinate system. Otherwise, yi is in the default spatial coordinate system.

Data Types: double

Image limits in world coordinates along the x-dimension, specified as a 2-element numeric vector of the form [xmin xmax]. The value of xref sets the image XData. The data type of xref and yref must match.

Data Types: single | double

Image limits in world coordinates along the y-dimension, specified as a 2-element numeric vector of the form [ymin ymax]. The value of yref sets the image YData. The data type of xref and yref must match.

Data Types: single | double

Interpolation method, specified as 'nearest' for nearest-neighbor interpolation, 'bilinear', or 'bicubic'.

Data Types: char | string

Output Arguments

collapse all

Sampled pixel values, returned as an n-by-1 numeric vector when I is a grayscale or binary image, or an n-by-1-by-3 numeric array when I is an RGB image.

Data Types: double

x-coordinate of sampled pixels, returned as an n-by-1 numeric vector.

Data Types: double

y-coordinate of sampled pixels, returned as an n-by-1 numeric vector.

Data Types: double

x-coordinate of line segment endpoints, returned as a numeric vector. If you specify line segment endpoints using xi, then xi2 is equal to xi.

Data Types: double

y-coordinate of line segment endpoints, returned as a numeric vector. If you specify line segment endpoints using yi, then yi2 is equal to yi.

Data Types: double

Version History

Introduced before R2006a