Main Content

このページの内容は最新ではありません。最新版の英語を参照するには、ここをクリックします。

computeBoundaryModel

クロソイド車線境界線モデルから車線境界線の点を計算

説明

yworld = computeBoundaryModel(boundary,xworld) は、x 座標 xworld によって指定された点における車線境界線 boundary から導出した、車線境界線の点の y 座標 yworld を返します。すべての点がワールド座標で示されます。

すべて折りたたむ

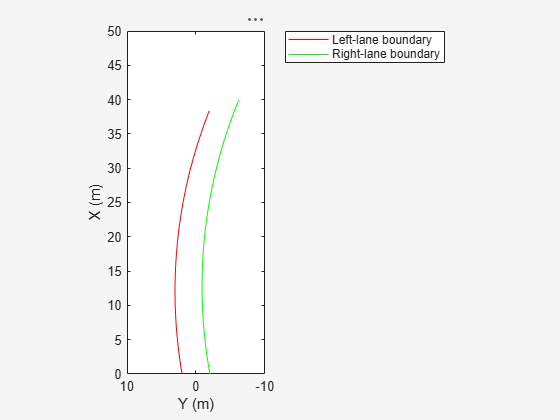
左右の車線境界線を表すクロソイド曲線を作成します。次に、曲線をプロットします。

左の境界線を作成します。

lb = clothoidLaneBoundary('BoundaryType','Solid', ...
'Strength',1,'Width',0.2,'CurveLength',40, ...
'Curvature',-0.8,'LateralOffset',2,'HeadingAngle',10);

ほぼ同じプロパティを使用して、右の境界線を作成します。

rb = lb;
rb.LateralOffset = -2;

鳥瞰図プロットを作成します。次に、車線境界線プロッターを作成して、境界線をプロットします。

bep = birdsEyePlot('XLimits',[0 50],'YLimits',[-10 10]);
lbPlotter = laneBoundaryPlotter(bep,'DisplayName','Left-lane boundary','Color','r');
rbPlotter = laneBoundaryPlotter(bep,'DisplayName','Right-lane boundary','Color','g');
plotLaneBoundary(lbPlotter,lb)
plotLaneBoundary(rbPlotter,rb);
grid
hold on

Figure contains an axes object. The axes object with xlabel X (m), ylabel Y (m) contains 2 objects of type line. These objects represent Left-lane boundary, Right-lane boundary.

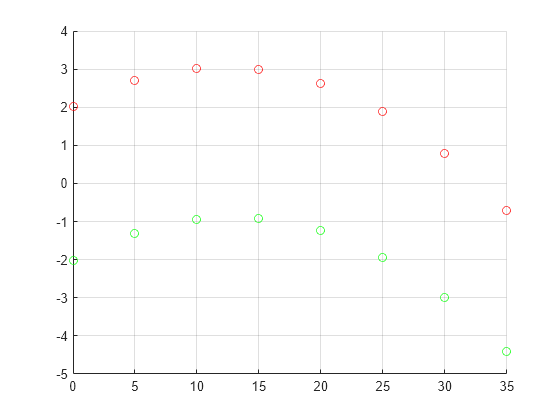
境界線に沿って選択した点の座標をプロットします。

x = 0:5:50;
yl = computeBoundaryModel(lb,x);
yr = computeBoundaryModel(rb,x);
plot(x,yl,'ro')
plot(x,yr,'go')
hold off

Figure contains an axes object. The axes object with xlabel X (m), ylabel Y (m) contains 4 objects of type line. One or more of the lines displays its values using only markers These objects represent Left-lane boundary, Right-lane boundary.

入力引数

すべて折りたたむ

車線境界線モデル。clothoidLaneBoundary オブジェクトとして指定します。

x ワールド座標。長さ N の実数値ベクトルとして指定します。ここで、N は座標の数です。

例: 2:2.5:100

データ型: single | double

出力引数

すべて折りたたむ

y ワールド座標。長さ N の実数値ベクトルとして返されます。ここで、N は座標の数です。yWorld の長さとデータ型は、xWorld と同じです。

データ型: single | double

バージョン履歴

R2018a で導入