Customize Buildings for Ray Tracing Analysis
This example shows how to customize the buildings stored in an OpenStreetMap® file and then perform ray tracing analysis on a scene created from the buildings. You can customize building attributes such as materials and colors.
The steps to perform ray tracing analysis on customized buildings include:
Read buildings from an OpenStreetMap file into a geospatial table.
Extract the buildings within an area of interest (AOI).
Customize the buildings by editing the geospatial table.
Import the buildings into Site Viewer.
Perform ray tracing analysis using the buildings and building materials.
Read Buildings from OpenStreetMap File
Specify the name of an OpenStreetMap file [1] containing data for several city blocks in Chicago.
filename = "chicago.osm";Read the building parts layer from the file by using the readgeotable function and specifying the Layer name-value argument as "buildingparts". The readgeotable function derives information about the buildings from the file and stores the result in a geospatial table. A geospatial table is a table or timetable with a Shape table variable and attribute table variables. The table represents the building parts using polygon shapes in geographic coordinates.
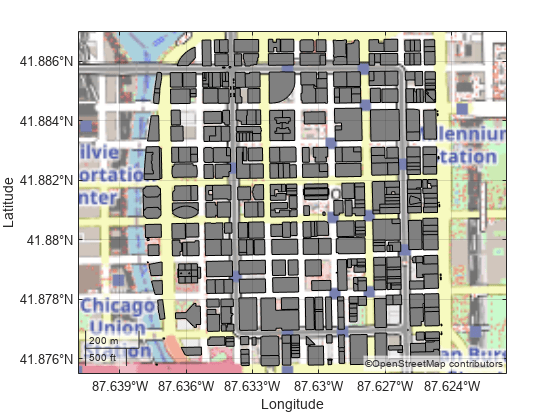
buildings = readgeotable(filename,Layer="buildingparts");Add the OpenStreetMap basemap as a custom basemap. View the building footprints over the OpenStreetMap basemap.
basemapName = "osm";
url = "a.tile.openstreetmap.org/${z}/${x}/${y}.png";
attribution = "©OpenStreetMap contributors";
addCustomBasemap(basemapName,url,Attribution=attribution)

figure
geobasemap(basemapName)
geoplot(buildings,FaceColor="#808080",FaceAlpha=1)
geotickformat dd
Specify Area of Interest
Define an AOI. To use a predefined AOI, specify interactivelySelectAOI as false. Alternatively, you can interactively select four points that define an AOI by specifying interactivelySelectAOI as true.
interactivelySelectAOI = false;
if interactivelySelectAOI
    [latAOI,lonAOI] = ginput(4);
else
    latAOI = [41.8794; 41.8782; 41.8782; 41.8794];
    lonAOI = [-87.6293; -87.6293; -87.6277; -87.6277];
end
Create a polygon shape from the AOI. Display the AOI on the same map.
latAOI(end+1) = latAOI(1);
lonAOI(end+1) = lonAOI(1);
AOI = geopolyshape(latAOI,lonAOI);

hold on
geoplot(AOI,FaceColor="m",FaceAlpha=0.2,EdgeColor="m",LineWidth=2)
Extract Buildings Within Area of Interest
Get the polygon shapes from the geospatial table. Clip the shapes to the AOI.
shape = buildings.Shape;
clipped = geoclip(shape,AOI);
Find the shapes that lie entirely or partially within the AOI by using logical indexing. When a polygon shape lies completely outside the AOI, the clipped shape has no coordinate data and the NumRegions property of the shape is 0.
idxInsideAOI = clipped.NumRegions > 0;
Create a new geospatial table that contains only the buildings that are entirely or partially within the AOI.
buildingsAOI = buildings(idxInsideAOI,:);
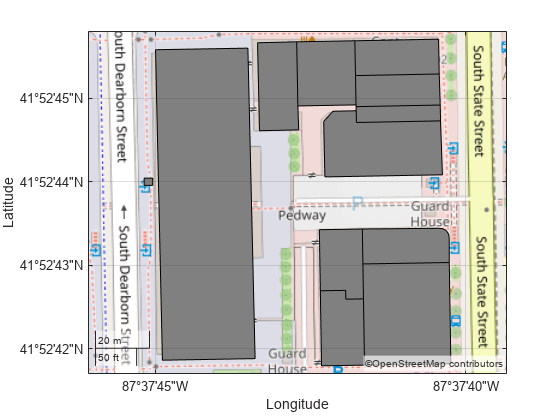
Display the buildings within the AOI on a new map.
figure
geobasemap(basemapName)
geoplot(buildingsAOI,FaceColor="#808080",FaceAlpha=1)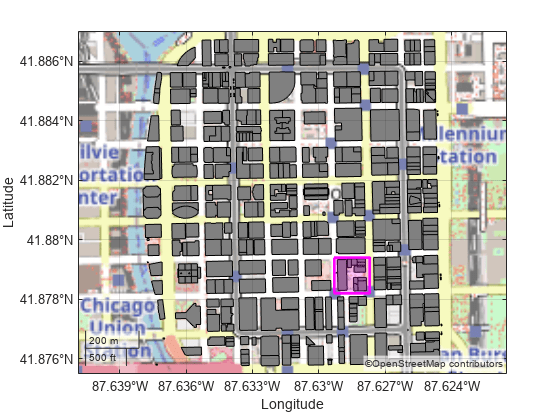
Customize Buildings
Customize three buildings within the AOI by changing the building materials to glass, brick, and metal.
Specify the coordinates of a point within each building that you want to change. To use three predefined points, specify interactivelySelectBuildings as false. Alternatively, you can interactively select three points by specifying interactivelySelectBuildings as true.
interactivelySelectBuildings = false;
if interactivelySelectBuildings
    [latGlass,lonGlass] = ginput(1);
    [latBrick,lonBrick] = ginput(1);
    [latMetal,lonMetal] = ginput(1);
else
    latGlass = 41.8788;
    lonGlass = -87.6288;
    latBrick = 41.8790;
    lonBrick = -87.6283;
    latMetal = 41.8786;
    lonMetal = -87.6283;
end
Create point shapes from the coordinates.
pointGlass = geopointshape(latGlass,lonGlass);
pointBrick = geopointshape(latBrick,lonBrick);
pointMetal = geopointshape(latMetal,lonMetal);
Find the building associated with each point by using a loop. For each building part and each point, determine whether the point is in the building part. If the point is in the building part, update the material and color. Use a dark blue-green color for the glass building, a light red color for the brick building, and a dark gray color for the metal building. If the building part does not contain any of the points, then specify the building material as concrete and the building color as light gray. Specify the colors using hexadecimal color codes.
for row = 1:height(buildingsAOI)
    bldg = buildingsAOI.Shape(row);
    if isinterior(bldg,pointGlass)
        buildingsAOI.Material(row) = "glass";
        buildingsAOI.Color(row) = "#35707E";
    elseif isinterior(bldg,pointMetal)
        buildingsAOI.Material(row) = "metal";
        buildingsAOI.Color(row) = "#151513";
    elseif isinterior(bldg,pointBrick)
        buildingsAOI.Material(row) = "brick";
        buildingsAOI.Color(row) = "#AA4A44";
    else
        buildingsAOI.Material(row) = "concrete";
        buildingsAOI.Color(row) = "#808080";
    end
end
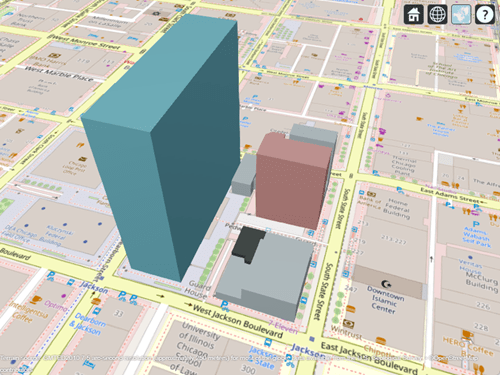
Import Buildings into Site Viewer
Import the buildings into Site Viewer. Display the buildings over the OpenStreetMap basemap.
viewer = siteviewer(Buildings=buildingsAOI,Basemap=basemapName);
View the materials stored in the Site Viewer object by querying the Materials property of the object. By default, ray tracing analysis functions such as raytrace use the materials stored in the MatchedCatalogMaterial table variable.
viewer.Materials
ans=4×2 table
     Material     MatchedCatalogMaterial
    __________    ______________________

    "brick"             "brick"
    "concrete"          "concrete"
    "glass"             "glass"
    "metal"             "metal"
Perform Ray Tracing Analysis
Create a transmitter site and a receiver site.
tx = txsite(Latitude=41.879090,Longitude=-87.628607);
rx = rxsite(Latitude=41.878410,Longitude=-87.628545);
Create a ray tracing propagation model, which MATLAB® represents using a RayTracing object. Configure the model to find propagation paths with up to three surface reflections. By default, the model uses the shooting and bouncing rays (SBR) method.
pm = propagationModel("raytracing",MaxNumReflections=3);Calculate the propagation paths and return the result as a cell array of comm.Ray objects. Extract the propagation paths from the cell array. Then, display the transmitter site, the receiver site, and the propagation paths.
rays = raytrace(tx,rx,pm);
rays = rays{1};

show(tx)
show(rx)
plot(rays)
View information about a path by clicking it. The information box displays the interaction materials.
You can also get information about propagation paths by viewing the properties of the comm.Ray objects. View the properties of the ninth path.
ray9 = rays(9)
ray9 =
  Ray with properties:

      PathSpecification: 'Locations'
       CoordinateSystem: 'Geographic'
    TransmitterLocation: [3×1 double]
       ReceiverLocation: [3×1 double]
            LineOfSight: 0
           Interactions: [1×3 struct]
              Frequency: 1.9000e+09
         PathLossSource: 'Custom'
               PathLoss: 91.7246
             PhaseShift: 0.1253

   Read-only properties:
       PropagationDelay: 3.0369e-07
    PropagationDistance: 91.0454
       AngleOfDeparture: [2×1 double]
         AngleOfArrival: [2×1 double]
        NumInteractions: 3
The NumInteractions property shows that the ninth path has three surface reflections. View the reflection materials for the path by querying the Interactions property of the path.
ray9.Interactions.MaterialName
ans =
"glass"
ans =
"metal"
ans =
"concrete"
[1] The OpenStreetMap file is downloaded from https://www.openstreetmap.org, which provides access to crowd-sourced map data all over the world. The data is licensed under the Open Data Commons Open Database License (ODbL), https://opendatacommons.org/licenses/odbl/.
See Also
Functions
readgeotable(Mapping Toolbox) |propagationModel|raytrace|addCustomBasemap
Objects
Topics
- Create Geospatial Tables (Mapping Toolbox)
- Define Areas of Interest (Mapping Toolbox)
- Data Stored in OpenStreetMap Layers (Mapping Toolbox)
- Display Buildings from OpenStreetMap Files (Mapping Toolbox)
- Urban Link and Coverage Analysis Using Ray Tracing
- Mobility Modeling with Ray Tracing Channel