このページは機械翻訳を使用して翻訳されました。最新版の英語を参照するには、ここをクリックします。
readgeotable
説明
T = readgeotable(filename,Name=Value)CoordinateSystemType 名前値引数を使用して座標系タイプを指定します。
例
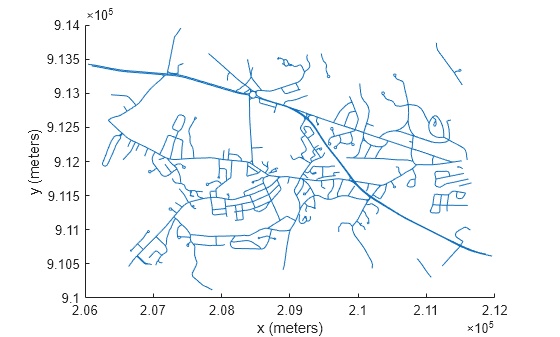
マサチューセッツ州コンコードの道路網を含むシェープファイルを、地理空間tableとしてワークスペースに読み込みます。
T = readgeotable("concord_roads.shp");tableの Shape 変数には、座標参照系 (CRS) を含む道路の形状に関する情報が含まれています。このシェープファイル内の道路の形状は投影された CRS を使用します。
T.Shape.ProjectedCRS
ans =
  projcrs with properties:

                    Name: "NAD83 / Massachusetts Mainland"
           GeographicCRS: [1×1 geocrs]
        ProjectionMethod: "Lambert Conic Conformal (2SP)"
              LengthUnit: "meter"
    ProjectionParameters: [1×1 map.crs.ProjectionParameters]
道路を地図上に表示します。
mapshow(T)
xlabel("x (meters)")
ylabel("y (meters)")
オプションの投影ファイル (.prj) は、シェープファイルの座標系タイプを決定します。シェープファイルに投影ファイルがないが、座標系の種類がわかっている場合は、CoordinateSystemType 名前値引数を使用して指定できます。
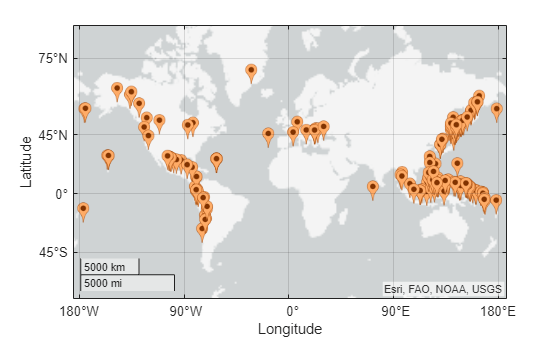
津波に関する情報を含む tsunamis.shp というシェープファイルをワークスペースに読み込みます。ファイルに付随するメタデータは、シェープファイルが地理座標を使用していることを示しています。
T = readgeotable("tsunamis.shp",CoordinateSystemType="geographic");
地理空間tableの Shape 変数を表示します。津波のソースの位置はポイントとして保存されます。
T.Shape
ans =
  162×1 geopointshape array with properties:

               NumPoints: [162×1 double]
                Latitude: [162×1 double]
               Longitude: [162×1 double]
                Geometry: "point"
    CoordinateSystemType: "geographic"
           GeographicCRS: []
ソースの場所を地図上にプロットします。
lat = T.Shape.Latitude;
lon = T.Shape.Longitude;
geoiconchart(lat,lon)
GPX ファイルには、ウェイポイント、トラック、トラック ポイント、ルート、ルート ポイントの最大 5 つのレイヤーを含めることができます。トラック ポイントまたはルート ポイントを含むレイヤーを読み取ると、地理空間tableには、ポイントをトラックまたはルートに関連付ける ID 変数が含まれます。
2 つのトラックを含む GPX ファイルのトラック レイヤーをインポートします。各トラックの Shape 変数は geolineshape オブジェクトです。
T = readgeotable("sample_tracks.gpx",Layer="tracks")
T=2×3 table
       Shape                                                  Name                                               Number
    ____________    _________________________________________________________________________________________    ______

    geolineshape    "Track logs from walking the perimeter of the MathWorks campus in Natick on May 21, 2007"      1
    geolineshape    "Track logs from biking from Concord to the MathWorks campus in Natick on June 30, 2011"       2
各トラックの形状を表示します。最初のトラックには 1 つのセグメントがあり、2 番目のトラックには 5 つのセグメントがあります。
T.Shape(1)
ans =
  geolineshape with properties:

                NumParts: 1
                Geometry: "line"
    CoordinateSystemType: "geographic"
           GeographicCRS: [1×1 geocrs]
T.Shape(2)
ans =
  geolineshape with properties:

                NumParts: 5
                Geometry: "line"
    CoordinateSystemType: "geographic"
           GeographicCRS: [1×1 geocrs]
トラック ポイント レイヤーをインポートします。各ポイントの Shape 変数は geopointshape オブジェクトです。
T2 = readgeotable("sample_tracks.gpx",Layer="track_points");
T2.Shape
ans =
  2586×1 geopointshape array with properties:

               NumPoints: [2586×1 double]
                Latitude: [2586×1 double]
               Longitude: [2586×1 double]
                Geometry: "point"
    CoordinateSystemType: "geographic"
           GeographicCRS: [1×1 geocrs]
2 番目のトラックのポイントのみを含むサブテーブルを作成します。このファイルでは、2 番目のトラックのポイントの TrackFID 値は 1 になります。
rows = (T2.TrackFID == 1);
T3 = T2(rows,:);
サブテーブル内のポイントを青いラインで表示します。
lat = T3.Shape.Latitude;
lon = T3.Shape.Longitude;
geoplot(lat,lon,Color="b")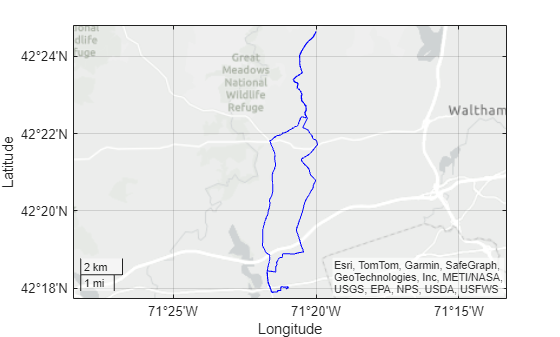
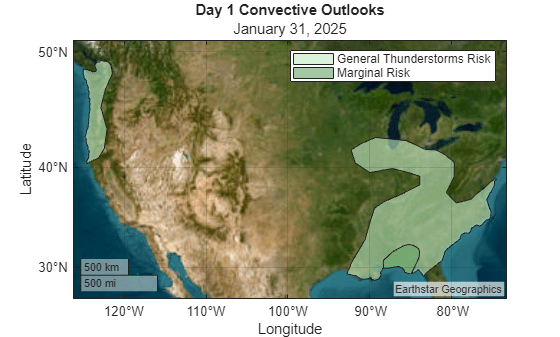
ウェブサイトから GeoJSON データを読み取り、ファイル storms.geojson に保存します。データには、NOAA/NWS Storm Prediction Center による 1 日目の対流予測が含まれています。対流の見通しの詳細については、[1]を参照してください。データへのリンクについては[2]を参照してください。
websave("storms.geojson","https://www.spc.noaa.gov/products/outlook/day1otlk_cat.lyr.geojson");
データを地理空間tableに読み込みます。激しい雷雨の脅威がない場合など、ファイルに readgeotable 関数が読み取るデータが含まれていない場合は、代わりに空のポリゴン形状を持つ地理空間tableを作成します。
try
    GT = readgeotable("storms.geojson");
catch
    GT = table(geopolyshape,"No Data","none",VariableNames=["Shape" "LABEL2" "fill"]);
end
地理空間tableの Shape 変数を表示します。tableには地理的領域がポリゴンとして保存されます。
GT.Shape
ans=2×1 geopolyshape array with properties:
              NumRegions: [2×1 double]
                NumHoles: [2×1 double]
                Geometry: "polygon"
    CoordinateSystemType: "geographic"
           GeographicCRS: [1×1 geocrs]
1 日目の対流の見通しは日ごとに変化するため、結果も異なる可能性があります。
衛星ベースマップ上に対流の見通しを表示します。雷雨リスク カテゴリから凡例を作成するには、tableの各行を個別のポリゴンとしてプロットします。
figure
geobasemap satellite
hold on
for k = 1:height(GT)
    row = GT(k,:);
    geoplot(row,"DisplayName",row.LABEL2,"FaceColor",row.fill)
end
legend
alpha(0.6)
アクセス日を含むタイトルを追加します。
dt = datetime("today",Format="MMMM d, yyyy");
title("Day 1 Convective Outlooks",string(dt))
[1] 「SPC製品」NOAA/National Weather Service Storm Prediction Center。2022年6月28日にアクセス。https://www.spc.noaa.gov/misc/about.html。
[2] 「SPCシェープファイル/ KML/KMZリンク」NOAA/National Weather Service Storm Prediction Center。2022年6月28日にアクセス。https://www.spc.noaa.gov/gis/。
R2023b 以降
OpenStreetMap® ファイルには、ポイント、ライン、マルチラインストリング、マルチポリゴン レイヤーなど、複数のデータ レイヤーが含まれています。readgeotable 関数が OpenStreetMap ファイルから読み取るデータは、指定するレイヤーによって異なります。
日本の東京、渋谷のいくつかの街区のデータを含むOpenStreetMapファイル[1]の名前を指定します。
filename = "shibuya.osm";ライン レイヤーを地理空間 table に読み込みます。ライン レイヤーは、道路、歩道、線路などの地物を表します。tableは、地理座標のラインの形状を使用して線を表します。
linesLayer = readgeotable(filename,Layer="lines");地図上にラインを表示します。
figure
geoplot(linesLayer)
title("Lines Layer")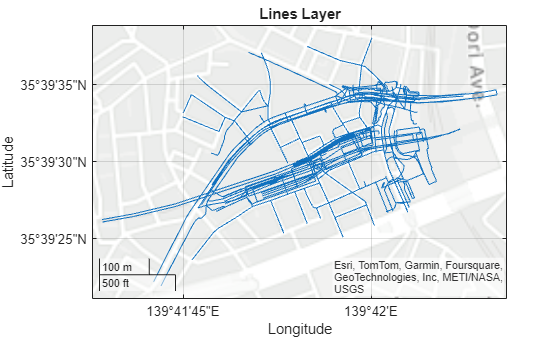
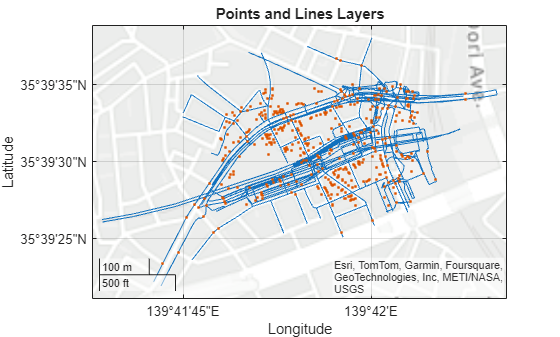
ポイント レイヤーを地理空間tableに読み込みます。ポイント レイヤーは、交通信号、バス停、地下鉄の入口などのフィーチャを表します。tableは、地理座標の点の形状を使用してポイントを表します。
pointsLayer = readgeotable(filename,Layer="points");同じ地図上にポイントを表示します。
hold on
geoplot(pointsLayer)
title("Points and Lines Layers")
鉄道や地下鉄の入口など、特定の地理的特徴の読み方については、Read Data from OpenStreetMap Files の例を参照してください。
[1] OpenStreetMapのファイルは、世界中のクラウドソースの地図データへのアクセスを提供するhttps://www.openstreetmap.orgからダウンロードできます。データは Open Data Commons Open Database License (ODbL)、https://opendatacommons.org/licenses/odbl/ に基づいてライセンスされています。
R2023b 以降
.osm 拡張子を持つ OpenStreetMap ファイルから、フットプリント、重心、高さなどの建物データを読み取ります。
日本の東京、渋谷のいくつかの街区のデータを含むOpenStreetMapファイル[1]の名前を指定します。
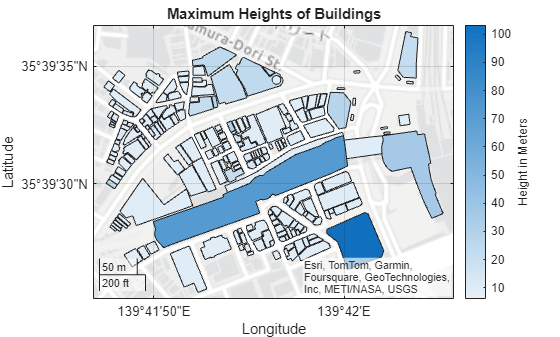
filename = "shibuya.osm";readgeotable 関数の Layer 名前値引数を "buildings" として指定して、建物レイヤーを地理空間tableに読み込みます。tableは地理座標の多角形形状を使用して建物を表しています。
buildingsLayer = readgeotable(filename,Layer="buildings");地図上に建物を表示し、建物の最大の高さを使用して色を適用します。タイトルを追加し、カラーマップを変更し、ラベル付きのカラーバーを追加します。
figure
geoplot(buildingsLayer,ColorVariable="MaxHeight")

title("Maximum Heights of Buildings")
colormap sky
c = colorbar;
c.Label.String = "Height in Meters";
地理空間tableに保存されている情報に基づいて建物データを表示する方法については、Display Buildings from OpenStreetMap Files の例を参照してください。
[1] OpenStreetMapのファイルは、世界中のクラウドソースの地図データへのアクセスを提供するhttps://www.openstreetmap.orgからダウンロードできます。データは Open Data Commons Open Database License (ODbL)、https://opendatacommons.org/licenses/odbl/ に基づいてライセンスされています。