このページは機械翻訳を使用して翻訳されました。最新版の英語を参照するには、ここをクリックします。
readgeoraster
地理空間ラスター データファイルの読み取り
構文
説明
例
ボストンのGeoTIFFイメージを配列およびマップ セル参照オブジェクトとして読み取ります。配列のサイズは 2881 x 4481 x 3 で、画像の赤、緑、青のコンポーネントを指定します。関数 mapshow を使用してイメージを表示します。
[A,R] = readgeoraster("boston.tif");
mapshow(A,R)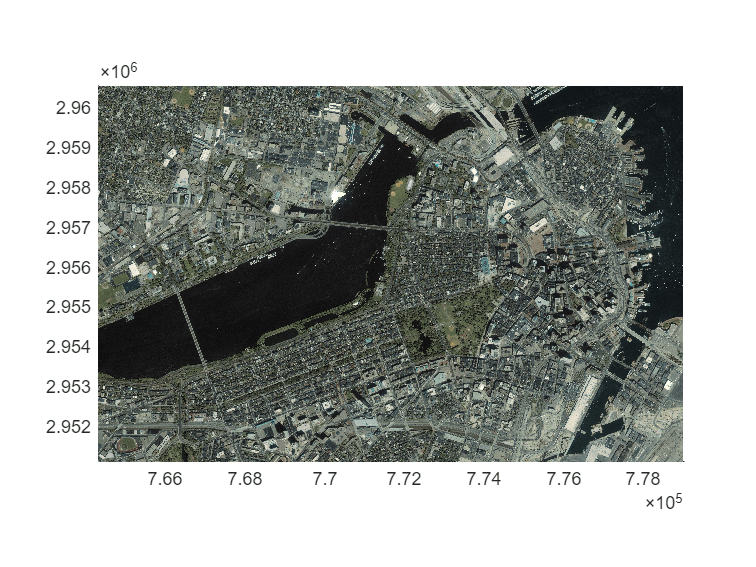
この例で使用されているデータには、GeoEye が著作権を所有する資料が含まれており、すべての権利は留保されています。
ハワイのオアフ島の土地被覆分類を読み取り、表示します。
まず、土地被覆データを配列、マップ セル参照オブジェクト、およびカラーマップとして読み取ります。A の要素はカラーマップにインデックスを付けます。カラーマップの各行は、単一の色の赤、緑、青の成分を指定します。次に、土地被覆データを表示します。
[A,R,cmap] = readgeoraster("oahu_landcover.img");
mapshow(A,cmap,R)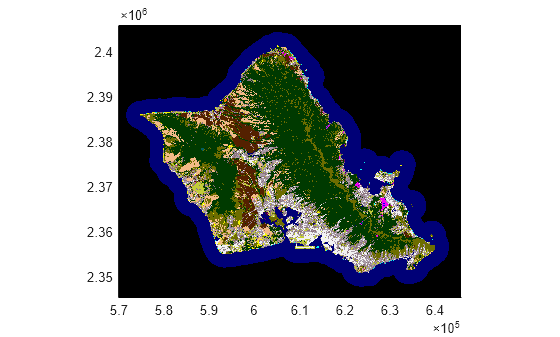
この例で使用されているデータは、米国海洋大気庁 (NOAA) から提供されたものです。
コロラド州のサウス ボルダー ピーク周辺の標高データを読み取り、表示します。
標高データを配列および地理的な投稿参照オブジェクトとして読み取ります。データをサーフェスとして表示するには、geoshow 関数には double または single タイプのデータが必要です。この場合、出力タイプを「double"」に指定して精度を維持します。
[A,R] = readgeoraster("n39_w106_3arc_v2.dt1",OutputType="double");
データの緯度と経度の制限を指定してマップを作成します。次に、geoshow 関数を使用してデータをサーフェスとして表示します。demcmap 関数を使用して、標高データに適したカラーマップを適用します。
latlim = R.LatitudeLimits;
lonlim = R.LongitudeLimits;
usamap(latlim,lonlim)
geoshow(A,R,DisplayType="surface")
demcmap(A)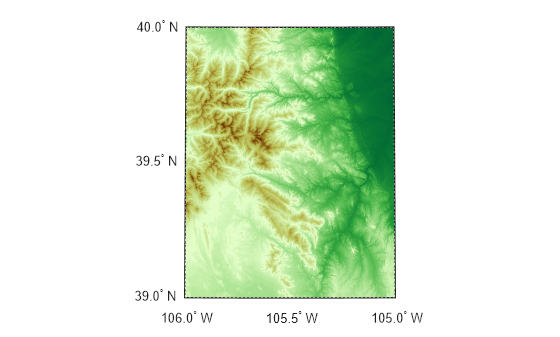
この例で使用されている標高データは、米国地質調査所から提供されたものです。
R2023b 以降
GRIB ファイルは多くの場合、複数のバンドを使用してデータを保存します。どのバンドを読み取るかわからない場合は、GRIB ファイルに保存されているメタデータを照会できます。
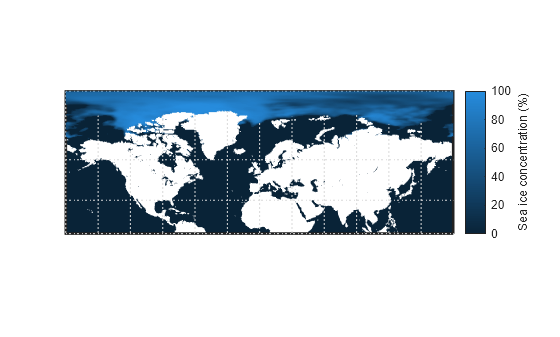
GRIB ファイルからデータ バンドを読み取って表示します。ファイルには複数年の海氷密接度 [1][2] が含まれており、ファイルの各バンドは異なる年に対応しています。
RasterInfo オブジェクトを作成して、GRIB ファイルに関する情報を取得します。RasterInfo オブジェクトの Metadata プロパティにアクセスしてメタデータを取得します。
info = georasterinfo("seaice.grib");
metadata = info.Metadata;
RasterInfo オブジェクトはtableを使用して GRIB メタデータを格納します。tableの各行はファイル内のデータのバンドに対応します。2016 年のデータが含まれるバンドを見つけます。
yrs = year(metadata.ReferenceTime);
band = find(yrs == 2016);
readgeoraster 関数を使用してバンドからデータを読み取ります。濃度をパーセンテージに変換します。
[A,R] = readgeoraster("seaice.grib",Bands=band);
A = A * 100;
データを axesm ベースのマップ上のサーフェスとして表示します。カラーマップを変更し、ラベル付きのカラーバーを追加します。
figure
worldmap(A,R)
mlabel off
plabel off
geoshow(A,R,DisplayType="surface")

colormap abyss
c = colorbar;
c.Label.String = "Sea ice concentration (%)";
[1] Hersbach, H.、B. Bell、P. Berrisford、G. Biavati、A. Horányi、J. Muñoz Sabater、J. Nicolas、他。「1940 年から現在までの ERA5 単一レベルの時間別データ」コペルニクス気候変動サービス(C3S)気候データストア(CDS)、2023年。2023年5月22日にアクセス。https://doi.org/10.24381/cds.adbb2d47。
[2] 欧州委員会もECMWFも、コペルニクスの情報やそれに含まれるデータの使用については責任を負いません。
入力引数
名前と値の引数
出力引数
詳細
ヒント
一部の関数では、サーフェスを表示するための
geoshow関数など、singleまたはdouble型の入力引数が必要です。これらの関数でreadgeorasterの出力を使用するには、OutputType名前値引数を使用して、出力タイプを"single"または"double"として指定します。ファイル形式に関係なく、
readgeorasterによって返される配列には北から始まる列があり、参照オブジェクトのColumnsStartFromプロパティには"north"の値が設定されます。