MATLAB での Code Prover 解析結果の可視化
解析後、結果を MATLAB® table に読み取ることができます。この table を使用して、結果に関するグラフや統計を生成できます。MATLAB Report Generator™ をお持ちの場合は、PDF レポートまたは HTML レポートにこれらの table やグラフを含めることができます。
結果を MATLAB table にエクスポート
既存の Polyspace® 解析結果を MATLAB table に読み取るには、解析結果に関連付けられた polyspace.CodeProverResults オブジェクトを使用します。
たとえば、MATLAB インストール フォルダーの読み取り専用サブフォルダー polyspace/examples/cxx/Code_Prover_Example/Module_1/CP_Result に含まれるデモの結果を読み取るには、結果を書き込み可能なフォルダーにコピーして読み取ります。
resPath = fullfile(polyspaceroot, 'polyspace', ...
    'examples', 'cxx', 'Code_Prover_Example', 'Module_1','CP_Result');

userResPath = tempname;
copyfile(resPath,userResPath);

resObj = polyspace.CodeProverResults(userResPath);
resSummary = getSummary(resObj);
resTable = getResults(resObj);
resSummary と resTable は、Polyspace の結果の概要と詳細を含む 2 つの MATLAB table です。あるいは、polyspace.Project オブジェクトを使用して C/C++ ソース ファイルに Polyspace 解析を実行できます。解析後、オブジェクトの Results プロパティに結果が含まれます。MATLAB スクリプトを使用した Polyspace 解析の実行を参照してください。
結果からグラフを生成してレポートに含める
MATLAB table の解析結果は便利な形式で可視化できます。MATLAB Report Generator をお持ちの場合は、可視化を含む PDF レポートまたは HTML レポートを作成できます。
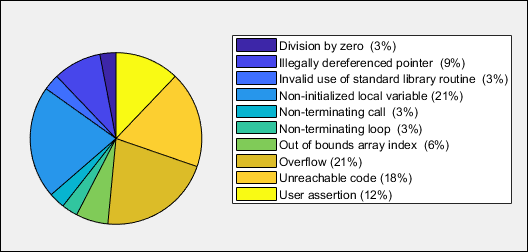
この例では、レッド、グレー、およびオレンジの実行時チェックの分布をチェック タイプ別に示す円グラフを作成し、そのグラフをレポートに含めます。
%% This example shows how to create a pie chart from your results and append
% it to a report.

%% Generate Pie Chart from Polyspace Results

% Copy a demo result set to a temporary folder.
resPath = fullfile(polyspaceroot,'polyspace','examples','cxx', ...
    'Code_Prover_Example','Module_1','CP_Result');
userResPath = tempname;
copyfile(resPath,userResPath);

% Read results into a table.
resObj = polyspace.CodeProverResults(userResPath);
resTable = getResults(resObj);

% Keep results that are run-time checks and eliminate green checks.
matches = (resTable.Family == 'Run-time Check') &...
    (resTable.Color  ~= 'Green');
checkTable = resTable(matches, :);

% Create a pie chart showing distribution of checks.
checkList = removecats(checkTable.Check);
pieChecks = pie(checkList);
labels = get(pieChecks(2:2:end),'String');
set(pieChecks(2:2:end),'String','');
legend(labels,'Location','bestoutside')

% Save the pie chart.
print('file','-dpng');


%% Append Pie Chart to Report
% Requires MATLAB Report Generator

% Create a report object.
import mlreportgen.dom.*;
report = Document('PolyspaceReport','html');

% Add a heading and paragraph to the report.
append(report, Heading(1,'Code Prover Run-Time Errors Graph'));
paragraphText = ['The following graph shows the distribution of ' ...
               'run-time errors in your code.'];
append(report, Paragraph(paragraphText));

% Add the image to the report.
chartObj = Image('file.png');
append(report, chartObj);

% Add another heading and paragraph to the report.
append(report, Heading(1,'Code Prover Run-Time Errors Details'));
paragraphText = ['The following table shows the run-time errors ' ...
               'in your code.'];
append(report, Paragraph(paragraphText));

% Add the table of run-time errors to the report.
reducedInfoTable = checkTable(:,{'File','Function','Check','Color',...
    'Status','Severity','Comment'});
reducedInfoTable = sortrows(reducedInfoTable,[1 2]);
tableObj = MATLABTable(reducedInfoTable);
tableObj.Style = {Border('solid','black'),ColSep('solid','black'),...
    RowSep('solid','black')};
append(report, tableObj);

% Close and view the report in a browser.
close(report);
rptview(report.OutputPath);
polyspace.CodeProverResults:Code Prover の結果を table に読み取る。pie:categorical 配列から円グラフを作成。代わりに、関数histogramまたはheatmapを使用することもできます。ヒストグラムを作成するには、スクリプト内の
pieをhistogramに置き換え、円グラフの凡例を削除します。mlreportgen.dom.Document(MATLAB Report Generator):レポート形式とレポートの格納場所を指定するレポート オブジェクトを作成。append(MATLAB Report Generator):既存のレポートにコンテンツを追加。
このスクリプトを実行すると、チェック タイプ別にチェックの分布が表示されます。このスクリプトでは、Polyspace チェックのグラフと table を含む HTML レポートも作成します。