show
R2026bアンテナ、アレイ、AI ベースのアンテナ、プラットフォーム、または形状の表示
説明
例
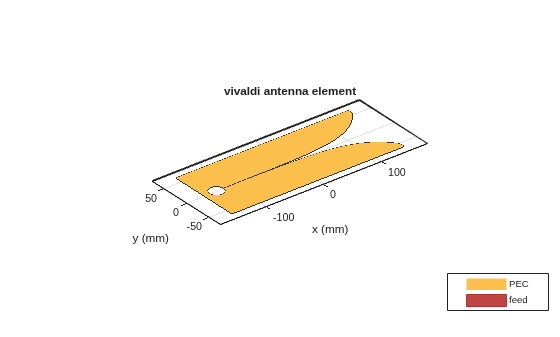
この例では、ビバルディ アンテナを作成し、そのアンテナ構造を表示する方法を示します。
h = vivaldi
h =
  vivaldi with properties:

             TaperLength: 0.2430
           ApertureWidth: 0.1050
             OpeningRate: 25
           SlotLineWidth: 5.0000e-04
          CavityDiameter: 0.0240
    CavityToTaperSpacing: 0.0230
       GroundPlaneLength: 0.3000
        GroundPlaneWidth: 0.1250
              FeedOffset: -0.1045
               Conductor: [1×1 metal]
                    Tilt: 0
                TiltAxis: [1 0 0]
                    Load: [1×1 lumpedElement]
show(h)
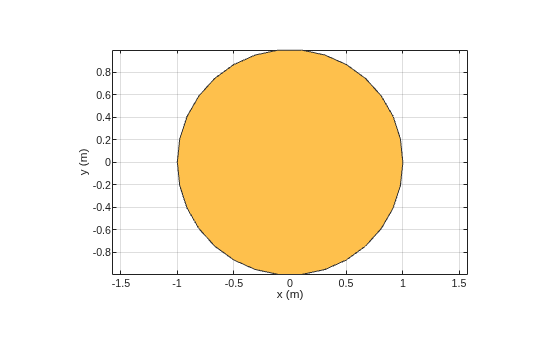
材料特性を指定せずに円の形状を作成し、塗りつぶされた領域を可視化します。
c1 = antenna.Circle
c1 =
  Circle with properties:

         Name: 'mycircle'
       Center: [0 0]
       Radius: 1
    NumPoints: 30
show(c1)
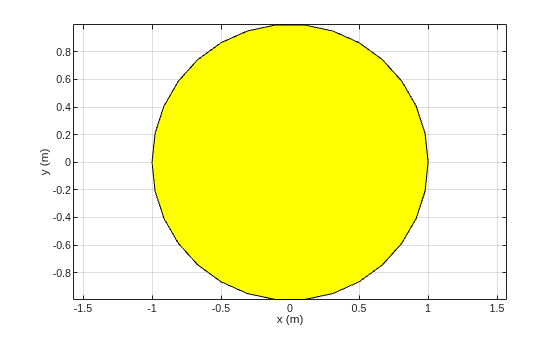
材料特性を指定して円の形状を作成し、塗りつぶされた領域を可視化します。
c2 = shape.Circle
c2 =
  Circle with properties:

            Name: 'mycircle'
          Center: [0 0]
          Radius: 1
       NumPoints: 30
           Metal: 'PEC'
           Color: 'y'
    Transparency: 1
       EdgeColor: 'k'
show(c2)
入力引数
バージョン履歴
R2015a で導入

