このページは機械翻訳を使用して翻訳されました。最新版の英語を参照するには、ここをクリックします。
satellite
衛星シナリオに衛星を追加する
構文
説明
satellite( は、地心天体基準座標系 (GCRF) で定義されたケプラー要素からの scenario,semimajoraxis,eccentricity,inclination,RAAN,argofperiapsis,trueanomaly)Satellite オブジェクトを衛星シナリオに追加します。
satellite( は、scenario,positiontable)positiontable で指定された位置データ (timetable オブジェクト) から Satellite オブジェクトをシナリオに追加します。この関数は、OrbitPropagator="ephemeris" を使用して Satellite を作成します。
satellite( は、scenario,positiontable,velocitytable)positiontable で指定された位置データ (timetable オブジェクト) と velocitytable で指定された速度データ (timetable オブジェクト) から Satellite オブジェクトをシナリオに追加します。この関数は、OrbitPropagator="ephemeris" を使用して Satellite を作成します。
satellite( は、scenario,positiontimeseries)positiontimeseries で指定された位置データから Satellite オブジェクトを scenario に追加します。この関数は、OrbitPropagator="ephemeris" を使用して Satellite を作成します。
satellite( は、scenario,positiontimeseries,velocitytimeseries)positiontimeseries (timeseries オブジェクト) で指定された位置 (メートル単位) データと、velocitytimeseries (timeseries オブジェクト) で指定された速度 (メートル/秒単位) データから、Satellite オブジェクトを scenario に追加します。この関数は、OrbitPropagator="ephemeris" を使用して Satellite を作成します。
satellite(___, は、以前の構文の任意の入力引数の組み合わせに加えて、1 つ以上の名前と値の引数を使用してオプションを指定します。 Name,Value)
sat = satellite(___)
メモ
satelliteScenario の AutoSimulate プロパティが false の場合、SimulationStatus が NotStarted の場合にのみ satellite を変更できます。restart 関数を使用して SimulationStatus を NotStarted にリセットできますが、これを行うとシミュレーション データが消去されます。
例
衛星シナリオ オブジェクトを作成します。
sc = satelliteScenario;
地球中心地球固定 (ECEF) 座標系で衛星エフェメリス時刻表を読み込みます。
load("timetableSatelliteTrajectory.mat","positionTT","velocityTT");
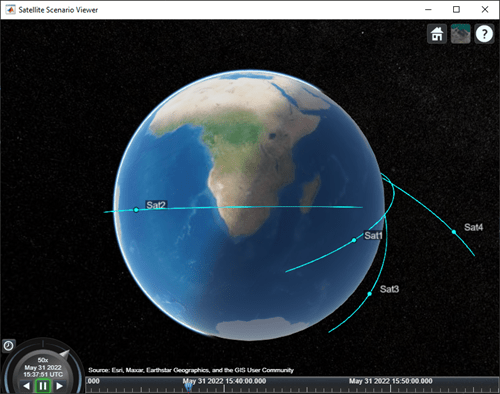
シナリオに 4 つの衛星を追加します。
sat = satellite(sc,positionTT,velocityTT,"CoordinateFrame","ecef");
衛星の軌道を可視化します。
play(sc);
衛星シナリオを作成し、緯度と経度から地上局を追加します。
startTime = datetime(2020,5,1,11,36,0);
stopTime = startTime + days(1);
sampleTime = 60;
sc = satelliteScenario(startTime,stopTime,sampleTime);
lat = 10;
lon = -30;
gs = groundStation(sc,lat,lon);
ケプラーの要素を使用して衛星を追加します。
semiMajorAxis = 10000000;
eccentricity = 0;
inclination = 10;
rightAscensionOfAscendingNode = 0;
argumentOfPeriapsis = 0;
trueAnomaly = 0;
sat = satellite(sc,semiMajorAxis,eccentricity,inclination, ...
        rightAscensionOfAscendingNode,argumentOfPeriapsis,trueAnomaly);
シナリオにアクセス解析を追加し、衛星と地上局間のアクセス間隔の表を取得します。
ac = access(sat,gs);
intvls = accessIntervals(ac)
intvls=8×8 table
       Source              Target          IntervalNumber         StartTime                EndTime           Duration    StartOrbit    EndOrbit
    _____________    __________________    ______________    ____________________    ____________________    ________    __________    ________

    "Satellite 2"    "Ground station 1"          1           01-May-2020 11:36:00    01-May-2020 12:04:00      1680          1            1
    "Satellite 2"    "Ground station 1"          2           01-May-2020 14:20:00    01-May-2020 15:11:00      3060          1            2
    "Satellite 2"    "Ground station 1"          3           01-May-2020 17:27:00    01-May-2020 18:18:00      3060          3            3
    "Satellite 2"    "Ground station 1"          4           01-May-2020 20:34:00    01-May-2020 21:25:00      3060          4            4
    "Satellite 2"    "Ground station 1"          5           01-May-2020 23:41:00    02-May-2020 00:31:00      3000          5            5
    "Satellite 2"    "Ground station 1"          6           02-May-2020 02:50:00    02-May-2020 03:39:00      2940          6            6
    "Satellite 2"    "Ground station 1"          7           02-May-2020 05:58:00    02-May-2020 06:47:00      2940          7            7
    "Satellite 2"    "Ground station 1"          8           02-May-2020 09:06:00    02-May-2020 09:56:00      3000          8            9
シナリオを再生して地上局を可視化します。
play(sc)

開始時刻を 2020 年 6 月 2 日午前 8 時 23 分 UTC に設定し、終了時刻を 1 日後に設定した衛星シナリオを作成します。シミュレーションのサンプル時間を 60 秒に設定します。
startTime = datetime(2020,6,02,8,23,0);
stopTime = startTime + days(1);
sampleTime = 60;
sc = satelliteScenario(startTime,stopTime,sampleTime);
ケプラーの要素を使用して、シナリオに 2 つの衛星を追加します。
semiMajorAxis = [10000000;15000000];
eccentricity = [0.01;0.02];
inclination = [0;10];
rightAscensionOfAscendingNode = [0;15];
argumentOfPeriapsis = [0;30];
trueAnomaly = [0;20];

sat = satellite(sc,semiMajorAxis,eccentricity,inclination, ...
    rightAscensionOfAscendingNode,argumentOfPeriapsis,trueAnomaly)
sat =
1x2 Satellite array with properties:
Name
ID
ConicalSensors
Gimbals
Transmitters
Receivers
Accesses
GroundTrack
Orbit
OrbitPropagator
MarkerColor
MarkerSize
ShowLabel
LabelFontColor
LabelFontSize
軌道上の衛星とグラウンド トラックを1 時間にわたって表示します。
show(sat)
groundTrack(sat,LeadTime=3600)
ans=1×2 object
  1×2 GroundTrack array with properties:

    LeadTime
    TrailTime
    LineWidth
    LeadLineColor
    TrailLineColor
    VisibilityMode
シナリオを再生し、シミュレーションのアニメーション速度を 40 に設定します。
play(sc,PlaybackSpeedMultiplier=40)

衛星シナリオを設定します。
startTime = datetime(2021,8,5);
stopTime = startTime + days(1);
sampleTime = 60; % seconds
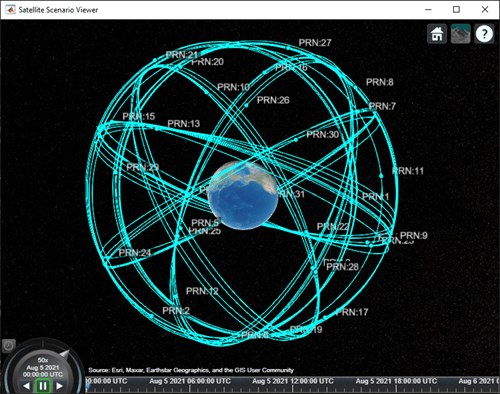
sc = satelliteScenario(startTime,stopTime,sampleTime);SEMアルマナックファイルからシナリオに衛星を追加します。
sat = satellite(sc,"gpsAlmanac.txt","OrbitPropagator","gps");
GPS コンステレーションを可視化します。
v = satelliteScenarioViewer(sc);
宇宙データシステム諮問委員会 ( CCSDS ) の軌道平均要素メッセージ (OMM) ファイルから衛星シナリオに衛星を追加します。
衛星シナリオを作成します。OMM ファイルで定義された元期をシナリオの開始時間として使用します (デフォルトの動作)。
startTime = datetime(2020,5,10,0,0,0);
stopTime = startTime + days(1);
sampleTime = 60; % seconds
sc = satelliteScenario(startTime,stopTime,sampleTime);
OMM ファイル eccentricOrbitSatellite.xml の衛星をシナリオ sc に追加します。OMM メタデータで提供されるデフォルト名を使用します。
sat1 = satellite(sc, "eccentricOrbitSatellite.xml")sat1 =
Satellite with properties:
Name: Satellite 41
ID: 1
ConicalSensors: [1x0 matlabshared.satellitescenario.ConicalSensor]
Gimbals: [1x0 matlabshared.satellitescenario.Gimbal]
Transmitters: [1x0 satcom.satellitescenario.Transmitter]
Receivers: [1x0 satcom.satellitescenario.Receiver]
Accesses: [1x0 matlabshared.satellitescenario.Access]
Eclipse: [1x0 Aero.satellitescenario.Eclipse]
GroundTrack: [1x1 matlabshared.satellitescenario.GroundTrack]
Orbit: [1x1 matlabshared.satellitescenario.Orbit]
CoordinateAxes: [1x1 matlabshared.satellitescenario.CoordinateAxes]
OrbitPropagator: sdp4
MarkerColor: [0.059 1 1]
MarkerSize: 6
ShowLabel: true
LabelFontColor: [1 1 1]
LabelFontSize: 15
Visual3DModel:
Visual3DModelScale: 1
衛星を可視化します。
v = satelliteScenarioViewer(sc);

シナリオを再生します。
play(sc);
入力引数
名前と値の引数
オプションの引数のペアを Name1=Value1,...,NameN=ValueN として指定します。ここで、Name は引数名で、Value は対応する値です。名前と値の引数は他の引数の後に指定しなければなりませんが、ペアの順序は重要ではありません。
例: Name = 'MySatellite' は衛星名を 'MySatellite' に設定します。
衛星状態座標系。'CoordinateFrame' と次のいずれかの値で構成されるコンマ区切りのペアとして指定されます。
"inertial"—timeseriesまたはtimetableデータの場合、この値を指定すると、GCRF フレーム内の位置と速度が受け入れられます。"ecef"—timeseriesまたはtimetableデータの場合、この値を指定すると、ECEF フレーム内の位置と速度が受け入れられます。"geographic"—timeseriesまたはtimetableデータの場合、この値を指定すると位置 [lat、lon、altitude] が受け入れられます。ここで、lat と lon は度単位の緯度と経度、altitude はメートル単位のWorld Geodetic System84 (WGS 84) 楕円体からの高さです。速度はローカル NED フレーム内にあります。
依存関係
この名前値引数を有効にするには、エフェメリスデータ入力 (
timetableまたはtimeseries) が必要です。fileが OMM ファイルの場合、この引数は無視されます。
データ型: string | char
GPS週元期。日付文字列として「dd-Mmm-yyyy」または「dd-Mmm-yyyy」形式で指定します。GPS週番号は、SEMアルマナックファイルで定義された週をカウントするときに関数が使用する参照日を指定します。GPSweekepoch を指定しない場合、関数は開始時刻の前の最新のGPS週番号ロールオーバー日付と一致する日付を使用します。
この引数は、SEMアルマナックファイルを使用する場合にのみ適用されます。GPSweekepoch を指定し、SEMアルマナックファイルを使用していない場合、関数は引数値を無視します。
依存関係
file が OMM ファイルの場合、この引数は無視されます。
データ型: string | char
衛星シナリオ ビューアー。スカラー、ベクトル、または satelliteScenarioViewer オブジェクトの配列として指定されます。シナリオの AutoSimulate プロパティが false の場合、シナリオに衛星を追加すると、以前使用可能だったタイムラインおよび再生ウィジェットがすべて無効になります。
このプロパティは、satellite 関数を呼び出すときにのみ設定できます。satellite 関数を呼び出した後、このプロパティは読み取り専用になります。
衛星名。'Name' と文字列スカラー、文字列ベクトル、文字ベクトル、または文字ベクトルのセル配列で構成されるコンマ区切りのペアとして指定されます。
衛星を 1 つだけ追加する場合は、
Nameを文字列スカラーまたは文字ベクトルとして指定します。複数の衛星を追加する場合は、
Nameを文字列スカラー、文字ベクトル、文字列ベクトル、または文字ベクトルのセル配列として指定します。文字列スカラーまたは文字ベクトルとして追加されたすべての衛星には、同じ指定された名前が割り当てられます。文字列ベクトルまたは文字ベクトルのセル配列内の要素数は、追加される衛星の数と等しくなければなりません。各衛星には、ベクトルまたはセル配列から対応する名前が割り当てられます。
衛星シナリオに衛星を追加した場合のデフォルト値は、
ケプラーの軌道要素、 TLEファイル - 「衛星ID」。ここで、
IDは衛星シナリオによって割り当てられます。SEMアルマナックファイルまたは RINEX GPSナビゲーション データ - 「PRN:prnValue」。ここで、prnValue は、SEMアルマナックファイルで指定されている衛星の疑似ランダム ノイズ コードを示す整数です。
RINEX Galileo ナビゲーション データ - 「GAL Sat IF: id」。ここで、「id」は RINEX ナビゲーション データで定義された Galileo衛星の衛星ID です。
タイムテーブル - タイムテーブルオブジェクトの変数名
Timeseries - 入力されている場合は Timeseries オブジェクトの名前、そうでない場合は「衛星 ID」。ID は衛星シナリオによって割り当てられます。
データ型: string
このプロパティは、satellite オブジェクトの作成時に設定することができ、その後このプロパティは読み取り専用になります。
衛星の位置と速度を伝播するために使用される軌道プロパゲーターの名前。次のいずれかのオプションとして指定します。
timetable、table、
timeseries、またはtscollectionを使用して衛星を指定する場合、OrbitPropagatorの値は"ephemeris"になります。SEMアルマナックファイルまたはGPSナビゲーション メッセージを含む RINEX データを使用して衛星を指定する場合、
OrbitPropagator値は次のいずれかのオプションを取ることができます。"gps"(既定)"sgp4""sdp4""two-body-keplerian""numerical"
Galileo ナビゲーション メッセージを含む RINEX データを使用して衛星を指定する場合、
OrbitPropagator値は次のいずれかのオプションを取ることができます。"galileo"(既定)"sgp4""sdp4""two-body-keplerian""numerical"
ケプラー要素を使用して衛星を追加するように指定する場合、
OrbitPropagator値はこれらのオプションのいずれかを取ることができます。"two-body-keplerian""sgp4""sdp4""numerical"
さらに、長半径が負の場合、
OrbitPropagatorの値は"numerical"のみになります。長半径が正の場合、デフォルト値は、周期が 225 分未満の場合は"sgp4"、周期が 225 分以上の場合は"sdp4"になります。TLEまたは OMM ファイルを使用して衛星を指定する場合、
OrbitPropagator値はこれらのオプションのいずれかを取ることができます。"two-body-keplerian""sgp4""sdp4""numerical"
軌道周期が 225 分未満の場合、デフォルトの
OrbitPropagator値は"sgp4"になります。それ以外の場合、デフォルトのOrbitPropagator値は"sdp4"になります。Keplerian要素を使用して衛星を指定する場合、OrbitPropagator値はこれらのオプションのいずれかを取ることができます。"two-body-keplerian""sgp4""sdp4"
RINEX データに有効なGPSと Galileo ナビゲーション メッセージの両方が含まれている場合、名前値引数を使用して OrbitPropagator を "gps" または "galileo" として指定することはできません。ただし、"two-body-keplerian"、"sgp4"、"sdp4"、または "numerical" として指定することもできます。
ビューアーでレンダリングするビジュアル 3D モデル ファイルの名前。拡張子が .GLTF、.GLB、または .STL の文字文字列として指定します。GLB および GLTF モデルの場合、gITF は右手座標系を使用します。gITF は、+Y を上、+Z を前、-X を右と定義します。gITF アセットは +Z に面しています。詳細については、https://registry.khronos.org/glTF/specs/2.0/glTF-2.0.html#coordinate-system-and-units を参照してください。GLB のメッシュはメートル単位です。

データ型: string
ビューアでレンダリングされるビジュアル 3D モデルの線形スケーリング。負でない整数として指定します。スケーリングでは、GLB モデルがメートル単位であることを前提としています。
データ型: double